NEO Price Escalates Over a Month; Bulls Manage to Take Control

- NEO coin seems bearish in the 1-day chart; the 1-Month chart shows a major price rise
- The coin is up by more than 50% as compared to its trading price a month ago
- NEO has traced a bullish trendline; SMA lines have just formed a bearish crossover; MACD still gives negative signs
A shy part of October has witnessed a bullish crypto market as till October 25, the total market capitalization of the digital currencies was sluggishly dropping. The last few days of the previous month have seen the market escalations in crypto space along with the NEO coin. However, the price has been declining for a couple of days amid volatility, but the future price prediction for NEO holds strong. Visit here our price prediction pages to know more about NEO price forecast for upcoming years.
NEO Price Analysis
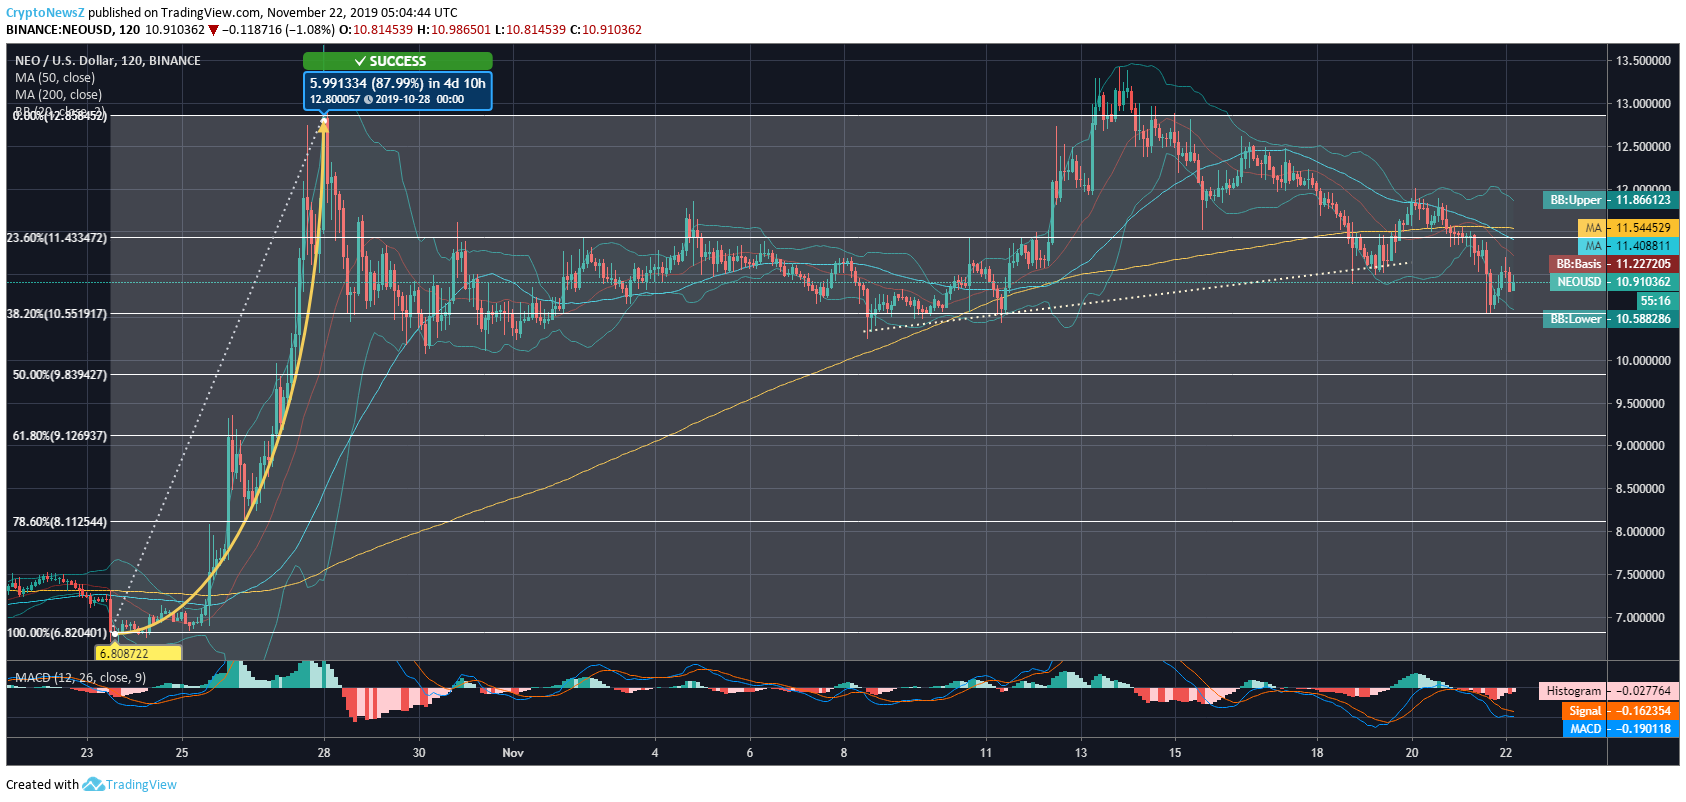
NEO price was trading below $8 on October 22, and it even had a close below $7 the next day. Seeing decent support there, the coin surged strongly above $12, with an increase of 87.99%. The pullback brought the coin to the price level of $10.17. From here, the coin kept consolidating around the Fib retracement level of 38.20% till the price rose above $12. The NEO coin has gradually corrected down from there and is trading at $10.91 at 05:04:44 UTC. Currently, the coin is approaching the Fib retracement level of 38.20%.

The technical indicators for the coin are entering a bearish zone currently, as the SMA lines have just traced a death cross giving a negative sign. The MACD indicator is below the zero-line with its signal line above the MACD line.
NEO price may see resistance level at $11.54, $12.03 and $12.46 while its support levels stand at $10.62, $10.19 and $9.7.


