Quant Falls Immediately After Bullish Candlewick Around $13

Quant, just like other cryptos of the market, has drawn an extended uptrend after the massive sell-off and market crash in March. Quant is one of the top interoperability platforms of the crypto market, and the native coin is one of the most lucrative projects in the market. QNT is moderately volatile crypto in itself and is currently trading with a bearish bias below $10 at $8.73 against the US Dollar.
Quant Price Analysis

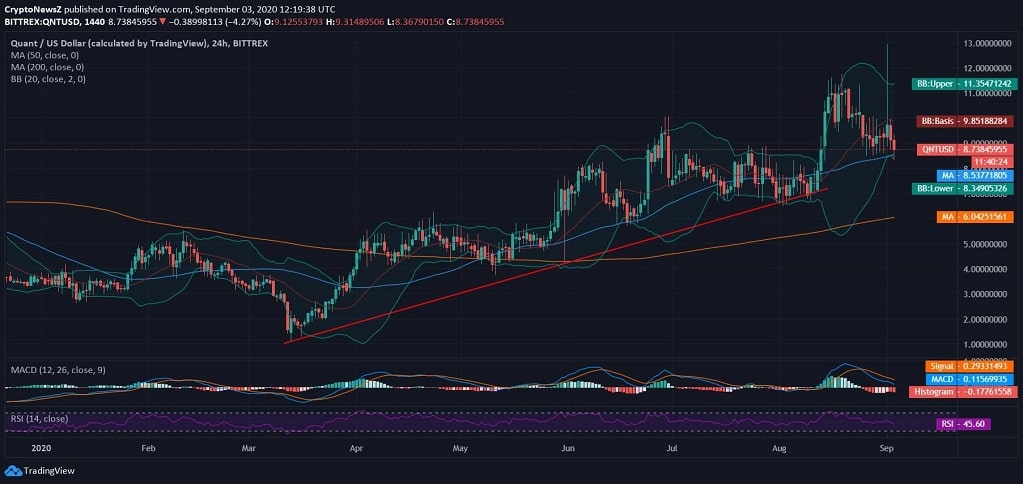
QNT, at the press time, was trading at $8.73 after an immediate pullback from a long bullish candlewick around $13. It was in the mid of the previous month when a complete crossover led to a positive crossover above $10 price area. With the immediate loss of gains and as per the quant price prediction, the Quant coin is now testing supports around MA50 at $8.5 and is holding complete support from MA200 at $6.04.
After breaching the upper Bollinger Band in the previous month, it has now plummeted close to the lower Bollinger Band. The MACD chart is holding a bearish crossover after the quick pullback. The RSI of QNT is lying at 45.60 after the intraday correction.


