Ren Faces Pullback from an ATH And Loses Over 60% in 10 Days

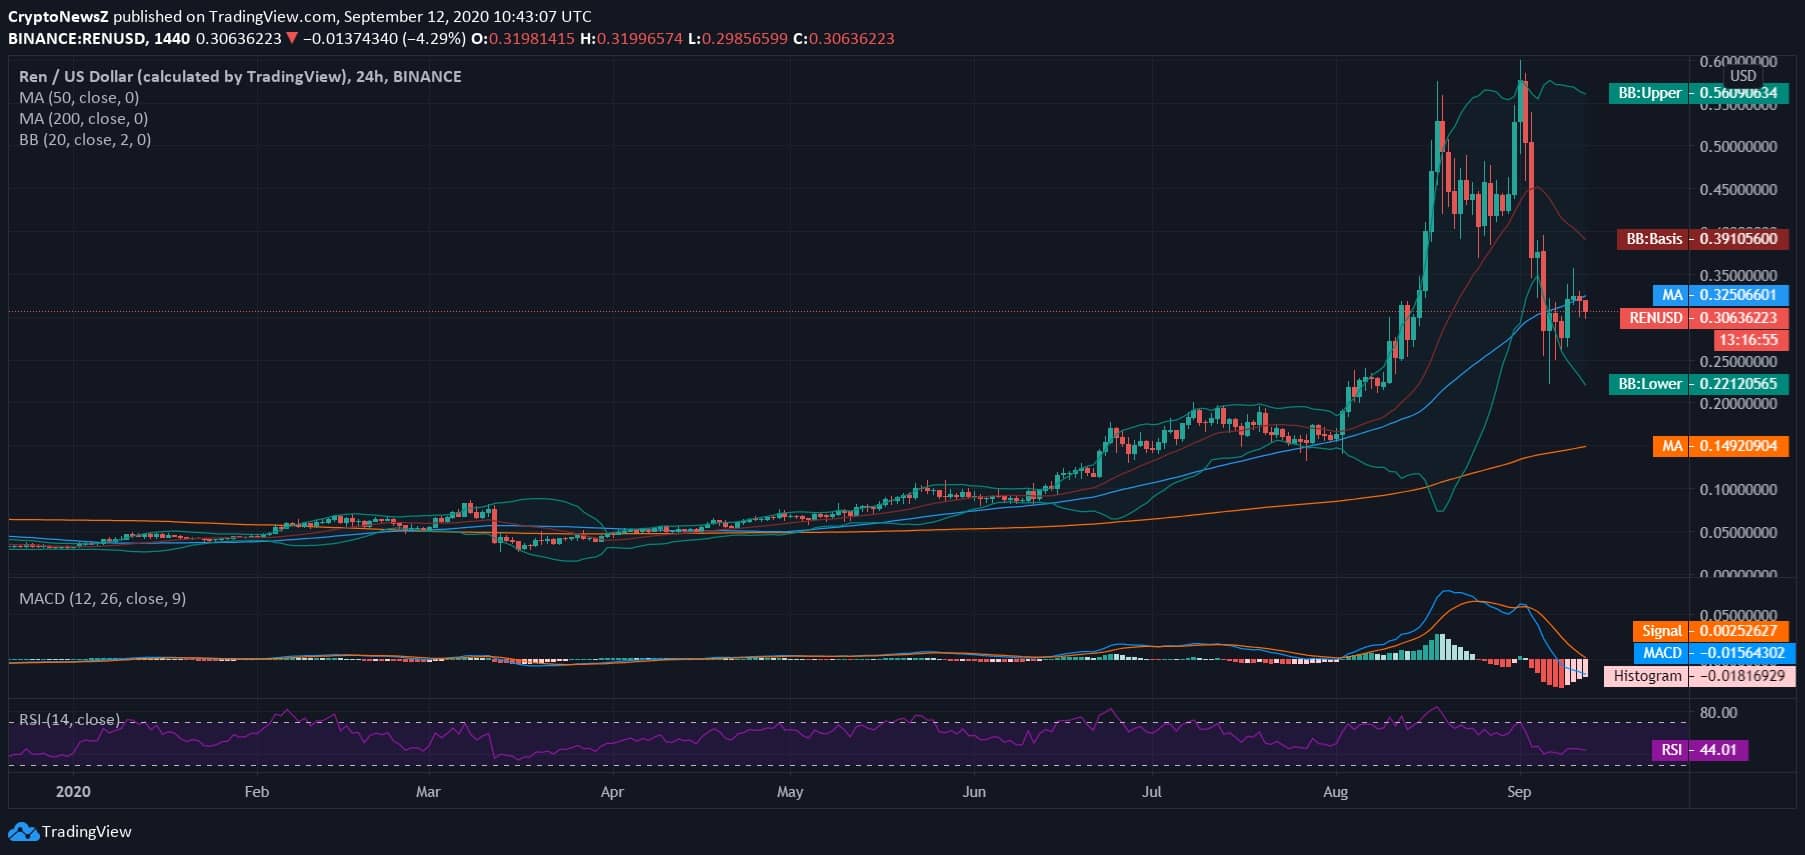
Ren—a DeFi based token platform amongst the top 100 most lucrative projects of the global market are seen trading at $0.306 with just lost support from MA50 after having plummeted from $0.35 in the intraday and testing daily supports around $0.30.
Ren, just like any other crypto token of the market as seen trading sideways until it marked a fresh All-Time High around $0.59 on the 1st day of the ongoing trading month. However, due to loss of momentum thereafter, REN/USD lost over 60% in less than two weeks and tested monthly supports below $0.25 as low as $0.22.
Ren Price Analysis

Ren, at the time of writing this analysis, was trading at $0.306 after a complete bearish crossover over the past ten days now. With a long steep candlestick on a 24-hour chart of REN/USD, the price slid from $0.53 to $0.34 in the previous week. It was since the beginning of the previous month when the price of the token amplified after a flat momentum against the greenback.
With a sluggish market trend and our Ren Price Prediction, the currency is drawing a negative bias too. With a notable pullback, the MACD indicator of the Ren token draws a bearish divergence. The RSI is inclined towards the support area at 44.01, with no extremities hit.


