Ripple (XRP) Exhibits 5% Escalation in Week-long Run

Ripple is marking a downtrend during the intraday movement. The price momentum has been quite impressive in the past 7-days time. The market has been fluctuating since the beginning of the month. However, XRP coin price tried to maintain uptrend during the same period. If we look at yesterday’s statistics, Ripple price was dealing at a high $0.299229 and a low at $0.289901.
Ripple Price Prediction
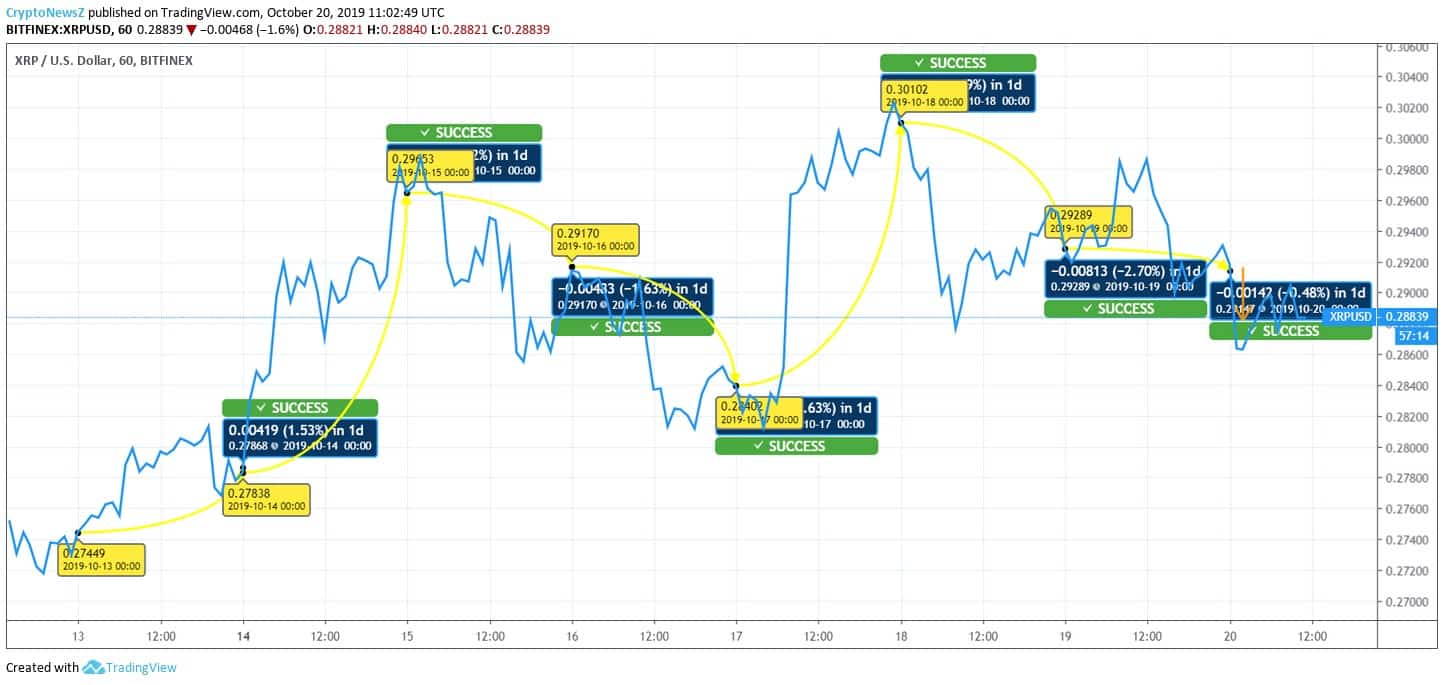
Ripple is reflecting upward movement on October 13, and the price moved from $0.27449 to $0.27838 by 1.53%. On the next day, the XRP coin skyrocketed and touched $0.2965 by 4.22% hike. On October 15, the price started falling. The counter touched $0.29170 by 1.63%. Further, on October 16, the price dropped to $0.28402 by 2.63%. Then, Ripple price reflected improvement and escalated to $0.30102 by 3.49%. On the next day, it slipped to $0.29289 by 2.70%. Yesterday, the price kept hovering around $0.292. Today, XRP coin slipped to $0.286 but recovered later and currently trading at $0.28839.

XRP price is sliding towards the immediate support level the $0.288. There is strong speculation that the price might breach the next support level of $0.284723. If Ripple starts moving upward, then the coin might breach its next resistance level at $0.2982. Here’s the list of calculated resistance and support levels:
| Resistance Level | Price |
| R1 | $0.2982 |
| R2 | $0.303379 |
| R3 | $0.307528 |
| Support Level | Price |
| S1 | $0.288872 |
| S2 | $0.284723 |
| S3 | $0.279544 |
Ripple is a result-oriented coin. The intraday traders might not have a positive closing, but in the coming days, the XRP coin would help draw good results. For best return, the traders are recommended to go with long-term investment.


