Ripple Price Analysis: XRP Resumes to Trade Towards Bottom, Bulls Left Miles Away

- XRP price was remarkably bullish between mid-May to mid-July
- Ripple shows a notable decrease in its price trend as compared to its price path a couple of months ago
- Ripple has recently broken below the major support level of $0.30
Ripple continues to go bearish even today and it has recently traded below $0.30 against U.S.Dollar. On the other hand, Bitcoin has remained above $11700 as yet.
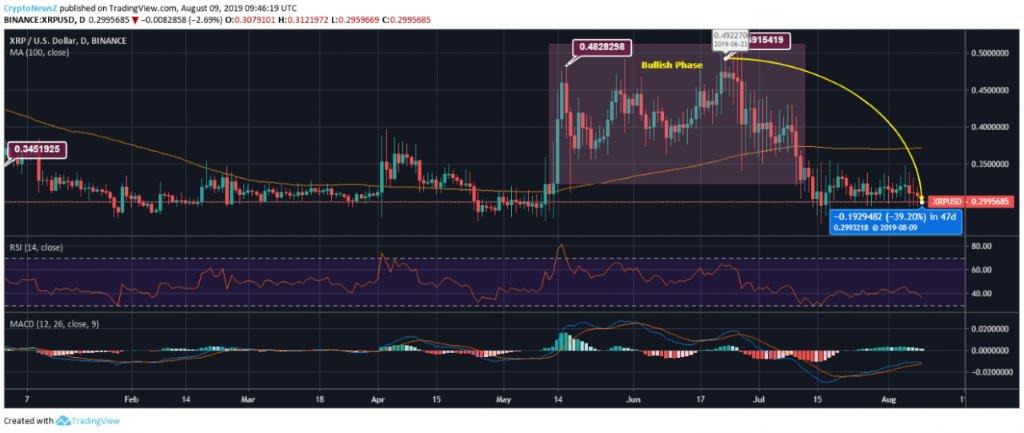
This year had started on a weak note for Ripple price as it kept ranging between $0.34 to $0.30 for quite a few months initially. However, today the coin is even below $0.30. The coin had seen a mild increase in April above $0.38 and later, XRP took a massive surge above $0.48 and even $0.49 during the month of June. The coin gradually but steadily kept decreasing after that till July.
As compared to its high price point of $0.4922, the coin is currently 39.20% down at $0.2995 at 09:46:19 UTC.
XRP/USD Price Chart
Ripple, at present, is 19.33% lower than its 100-day SMA of $0.3713. Also, the coin is still moving away from its 5-day SMA in the downward direction with selling pressure.
As XRP has breached its major support of $0.30, further price loss may take place. However, if the coin finds decent support and at least moves above $0.34, a stable momentum can be anticipated.
Ripple Price Prediction & Technical Indicators:
MACD for the coin is heading for a bearish crossover. RSI of XRP/USD is below 40, indicating the upcoming oversold phase. XRP may see resistance at $0.3117 and support at $0.3009.


