Ripple Price Analysis: XRP Sees a Mild Fall, is Rebound Around?

- Ripple saw a rejection above $0.2577, $0.26 price mark appears at-least a day or two away
- In the last 4 hours, XRP has breached support near $0.2560, traced a close at $0.2553
- A bearish trendline has been formed; SMA lines signal bearishness
Ripple price trend has been uplifted as compared to yesterday’s price scenario but is still failing to trade above $0.26. The coin is facing hurdles against U.S.Dollars at the moment.
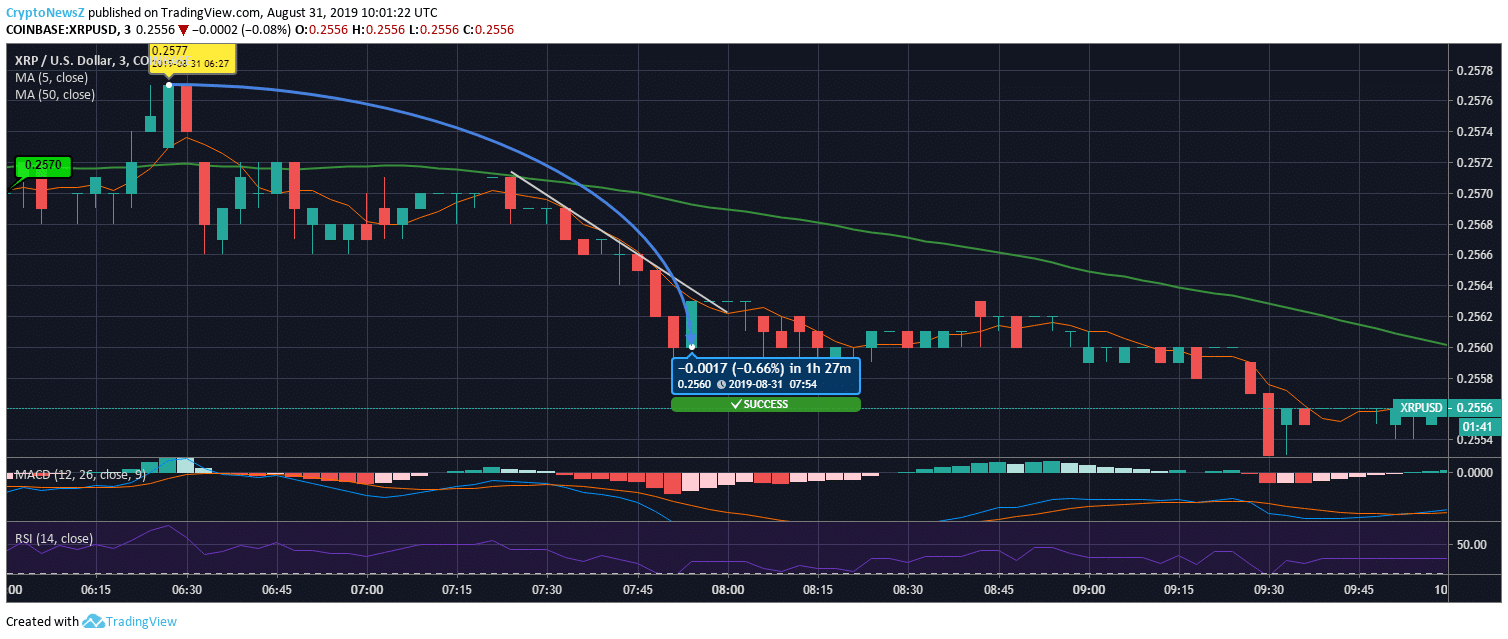
4 hours ago, Ripple was trading at $0.2570 and it took a high spike at $0.2577 before meeting a price fall. As the coin did not clear resistance above $0.2577, it tumbled (with a decline of 0.66%) while tracing a bearish trendline. The fall has stopped at $0.2560 and XRP remained above $0.2560 till 09:27 UTC. After tracing a close at $0.2555, XRP has corrected up to $0.2556 at 01:01:22 UTC.
In the last 4 hours, Ripple price has seen a loss of valuation by 0.54%.
XRP/USD Price Chart

SMA lines are giving bearish signs as the long term SMA line is above the short term SMA line with a notable gap. Also, its current price has just slipped below its 5-day SMA and is 3.61% down as compared to its 50-day SMA.
The price range above $0.2570 may pose as a strong price barrier if XRP resumes its price recovery. It is notable that the coin has been range-bound between $0.2500 to $0.2580 since a long time now. Also, XRP is trading with selling pressure.
Ripple Technical Indicators:
RSI for XRP/USD is between 50 and 30, showing no extremities. While MACD has just traced a bullish crossover. Ripple may face resistance at $0.2581, $0.26 and $0.262 while it can find support at $0.253, $0.2508 and $0.248.


