Ripple Price Analysis: XRP Tops $0.5 During Week-end, Followed by a Declining Correction

-
- Ripple price on Saturday traded above $0.50; setting a new 3-month high
- After a downward correction, XRP is currently trading at $0.4621
- 1-day price chart shows a bearish trend line negated by the recently formed bullish trend line
- Over the last 24 hours, XRP has decreased to 2.67%, though today, XRP price has started to recover
Ripple price gained remarkably on Saturday, surging above $0.50 against U.S Dollar. However, after that, it sharply pulled back but kept trading above $0.46 till today.
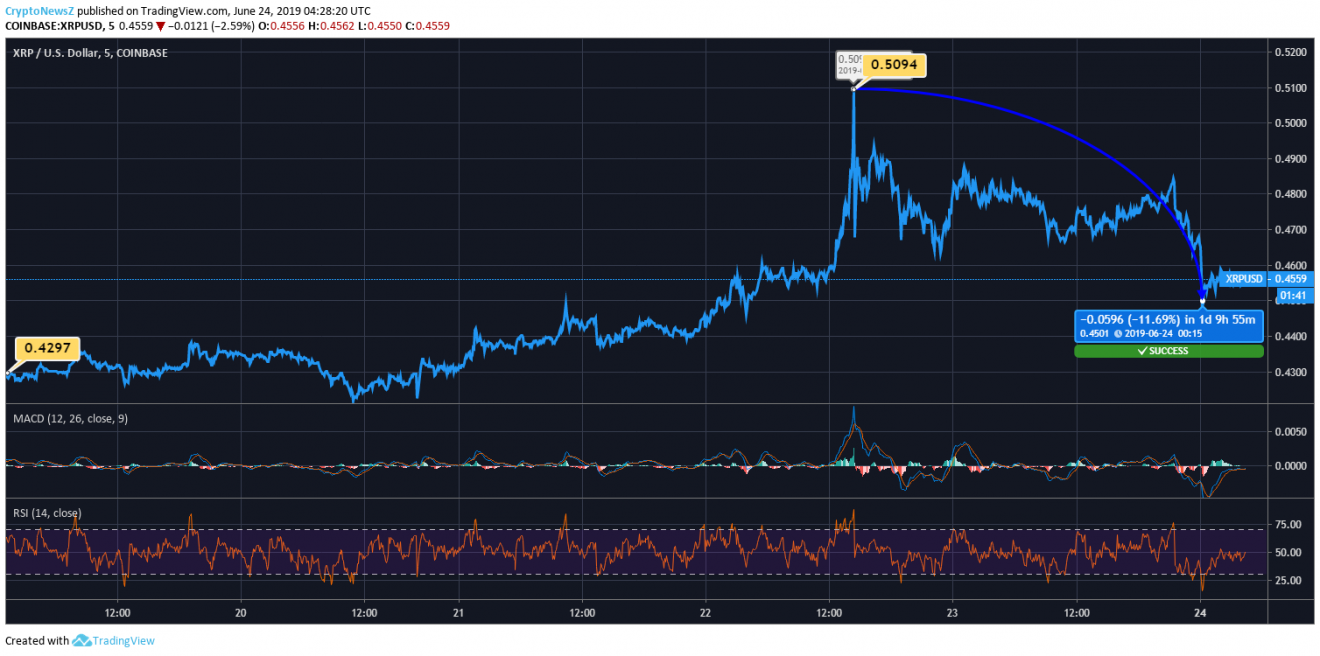
It’s more than a week since Ripple price has been growing partly due to two back-to-back bull runs in Bitcoin price. Clearing major resistances near $0.4500 and $0.4800, XRP price had sharply surged to $0.5094 hitting a new 3-month high price. Instead of maintaining its price range near $0.5, XRP corrected downward and remained above $0.46 till today. Over the last 5-days, XRP price has shown an increase of 7.54%.
Ripple 5-Day Price Chart By TradingView
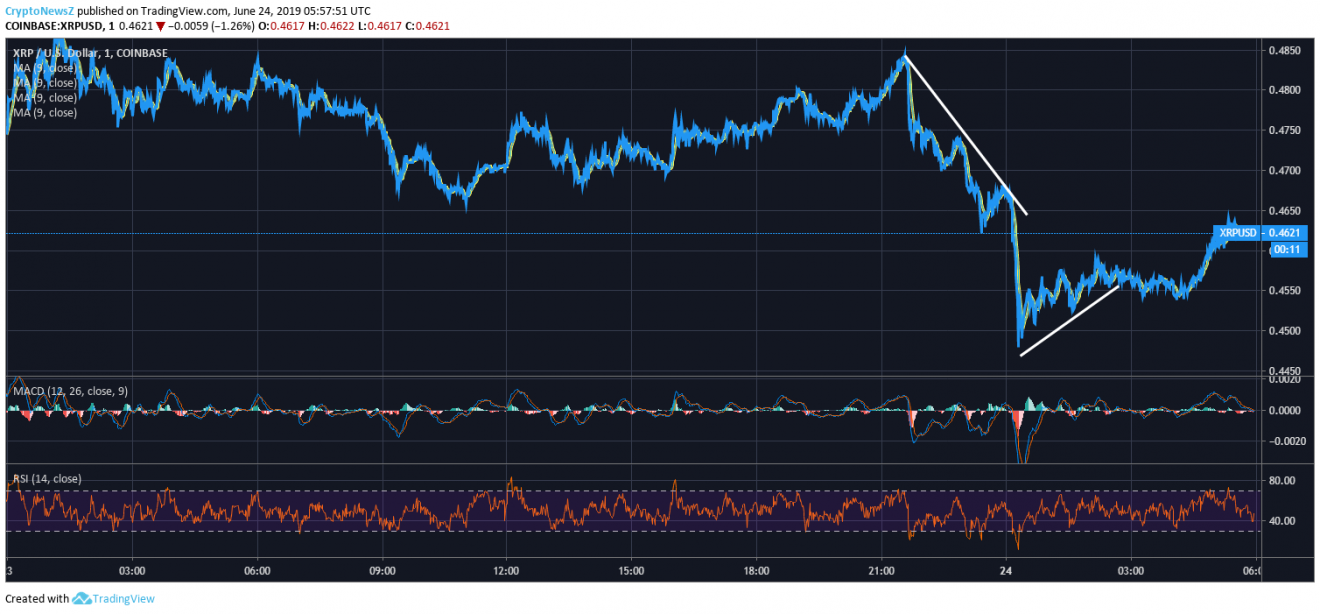
Yesterday, Ripple price opened at $0.4748 and it initially traded between $0.47 to $0.48. Breaking resistance above $0.47, the XRP price traced a swing low near $0.4679 before again surging above $0.48. Here, XRP price started to drop heavily tracing a bearish trend line. It had its closing price at $0.4682. Today, initially, Ripple has tumbled further and even broke a major support level of $0.45. Striking a price recovery, XRP is currently trading at $0.4621 at 05:07:51 UTC.
XRP/USD 1-Day Price Chart By TradingView
XRP indicates a bullish uptrend in its price as its SMA for short term is showing a gradual increase as compared to its long term SMA. Also, its current price of $0.4621 is 9.16% higher than its 30 day SMA of $0.4233.
Moreover, it is notable that the recent price rebound in XRP, that made the price to again reach above $0.46 is largely thanks to the strong support level near $0.44.
Technical Indicators:
RSI for XRP/USD is currently just below 50 signalling stability at the moment. Also, the MACD chart appears moderately volatile, which is turning into little volatile. The MACD line is currently below the signal line indicating a price decrease. Major resistance levels for Ripple seem to be at $0.4746 and $0.4927, while major support levels can be $0.4519 and $0.4473.


