

- XRP, at the time of writing this analysis, was drawing a slight bullish line as the MACD exhibited a bullish divergence
- The 20-day Bollinger Bands do not project any major volatile setback in the upcoming days as the bands are not seen widening
- The immediate support lies around $0.178, while the major support lies around $0.173 after lacking support from the daily MAs
- The intraday appears bullish as the price of XRP rebounds from immediate support with a trend revision
Ripple currency has been experiencing a price accumulation over a period of past seven days with a weekly low marked at $0.173 and a weekly high marked above $0.195.
XRP Price Analysis
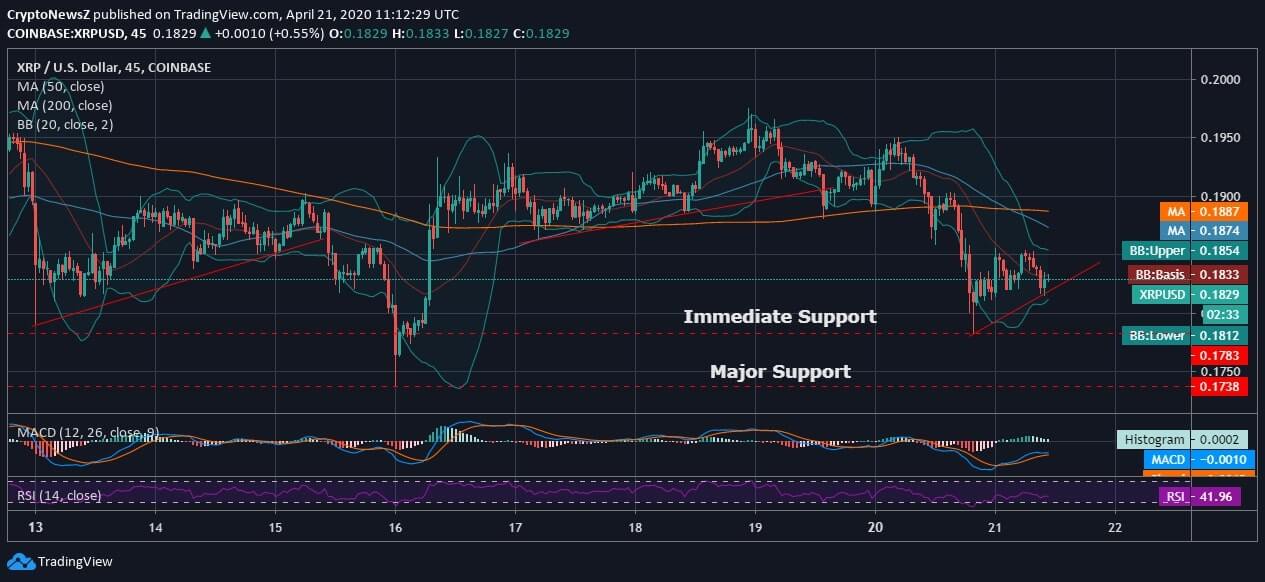
On the intraday chart, Ripple price today
appears bullish against the US Dollar after the coin had hit the immediate support at $0.178. The price trend of Ripple is currently hitting around the lower 20-day Bollinger Band and fails to retain support from the 50-day and 200-day daily Moving Averages. Over the past week, the price had been on a subtle uptrend with a price accumulating trend and moderate volatility.Technical Indicators
The technical indicators also highlight the intraday bullish divergence as the MACD of XRP coin crosses above the signal line, and the RSI lies at 41.96, withholding no trading extremities. Apart from that, Check out our XRP price prediction by experts to know more about the future prices of XRP coin.