Ripple (XRP): Is It a Dead Cat Bounce or Reversal Scenario?

Ripple, aka XRP, the native token of Ripple’s Blockchain is going through some important pivotal point as current prices may be a dead cat bounce, or it can indicate a complete reversal.
Analyzing XRP/USD prices further by using Candlestick, SMA (Simple Moving Averages), RSI (Relative Strength Index), Stoch RSI (Stochastic Relative Strength Index), Fibonacci Tool, MACD (Moving Average Convergence Divergence), and Supply/Resistance zone.
Ripple (XRP) Price Analysis:
Based on 1 Day Time Frame:
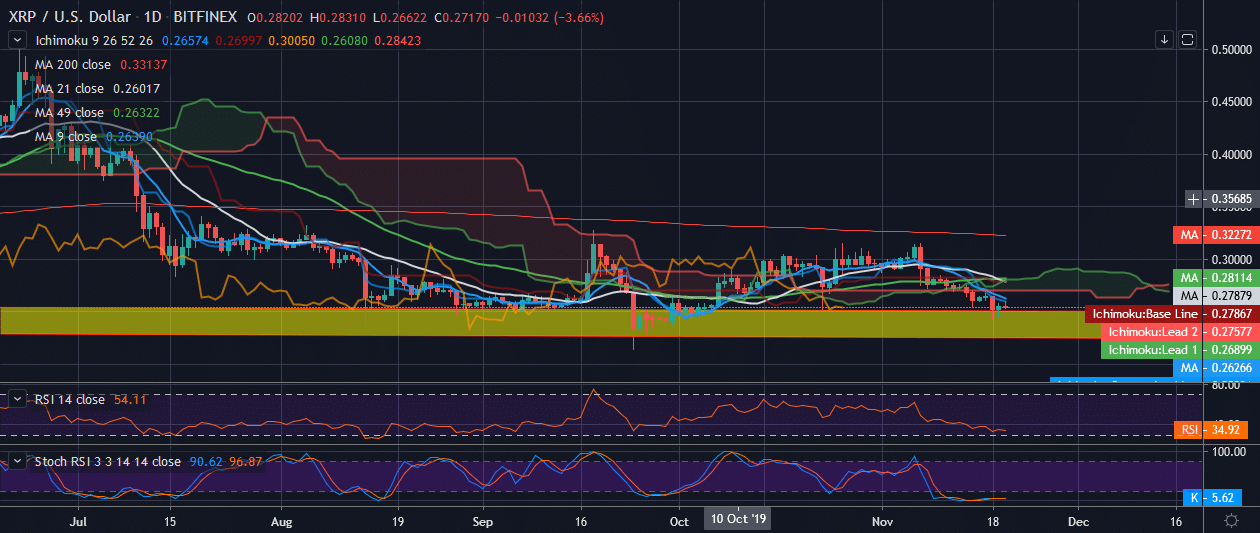
XRP prices are below the Kumo (cloud) area, and Senkou Span A and Senkou Span B failed to act as support here. Prices fell below the Tenkan Sen and Kijun Sen as well, but the good thing is Ripple prices are back to the critical support area marked by yellow area; thus, this area will act as strong support.
RSI (Relative Strength Index) is at 35 and indicating that the prices are almost oversold. Stoch RSI (Stochastic Relative Strength Index) clearly shows that the current XRP prices are oversold, and prices can see a reversal anytime soon.

4H Time Frame:
It is clear from the 4 Hour Time Frame that the price has bounced from the critical support area after hitting a low of $0.24 (see wick). Currently, prices are supported by 9-day SMA (simple moving average: solid blue line), and 21-day SMA (solid white line) rejected the prices and thus acting as resistance here.
Ripple needs some volume from buyers to push it through the 21 days SMA and 49 days SMA as well as claim its previous support at $0.27. If Ripple price is unable to push through 21 days SMA, then the downtrend will continue, and the prices will go deeper towards the critical support towards $0.22 although $0.23 might act as support here.
Laying Ichimoku over the previous chart also pretty much paints the same story. Prices are below the Kumo (cloud) hence bearish; prices are currently supported by Tenkan Sen (solid blue line) and Kijun Sen (solid red line). This might be a dead cat bounce or continuation towards critical support.
If prices push above, then the next resistance will be $0.26 and $0.27 indicated by Senkou Span A and Senkou Span B respectively.
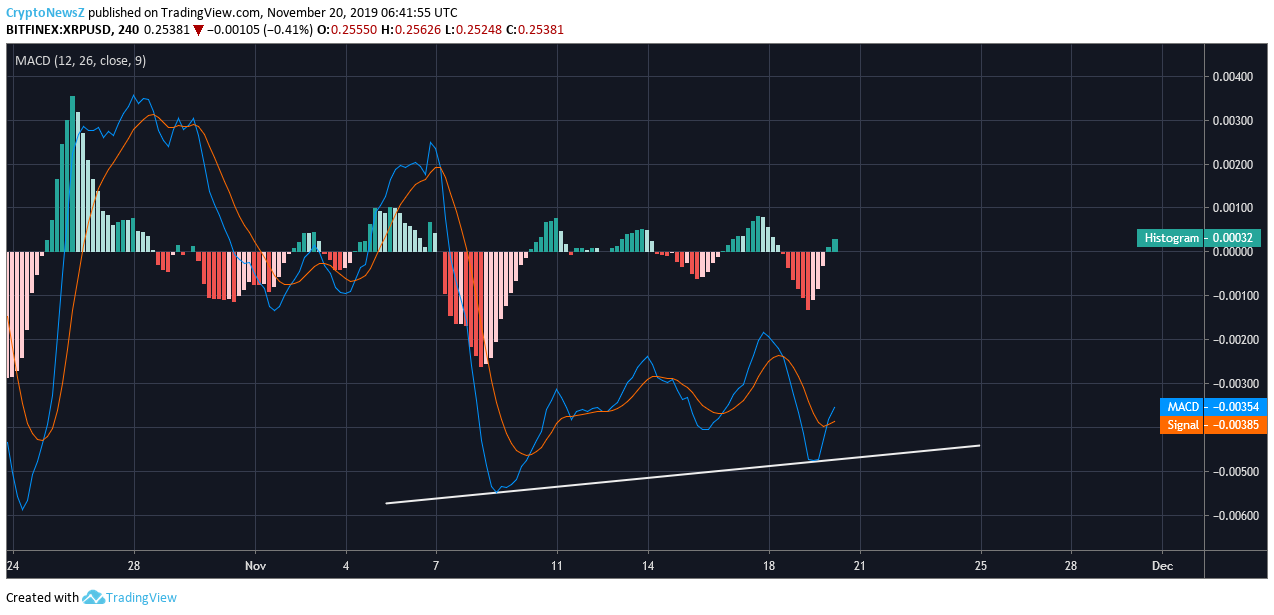
MACD makes a double bottom and also indicates there is a shift in momentum; thus, it may be signaling for a reversal as we have a Golden Cross.
RSI (Relative Strength Index) clearly showed that the prices went into the oversold area; hence, we saw some violent buying activities; thus Ripple price bounced after making a low of $0.24. Clearly RSI has pierced the trend line (white slope), which earlier acted as a resistance and can expect it to do a retest for support.
As Bitcoin is struggling to maintain its support of 78.6% Fib level, i.e. $8000 level, if BTC price falls below this we might see a sharp decline in XRP/USD price as well towards the critical support of $0.22.
If BTC reclaims its previous support of $8500 or $9000, we will see a clear reversal in XRP/USD price reaching towards $0.29. You can always check the Ripple price today from our price page with the live price chart.


