Ripple (XRP), Litecoin (LTC) & Ethereum (ETH) Fall On Their Knees; Indications Of Recovery Seems Promising

Ripple (XRP)/ USD Price Analysis:

Ripple (XRP) is one amongst the top-ranked cryptocurrencies in the crypto market. The market cap of the coin is marked as $13,084,090,344 at 11:13 UTC. The coin is one of the strongest tokens in the market. The momentum of the Ripple coin is tremendous, and hence we are quite positive that it would come off the price drop soon.
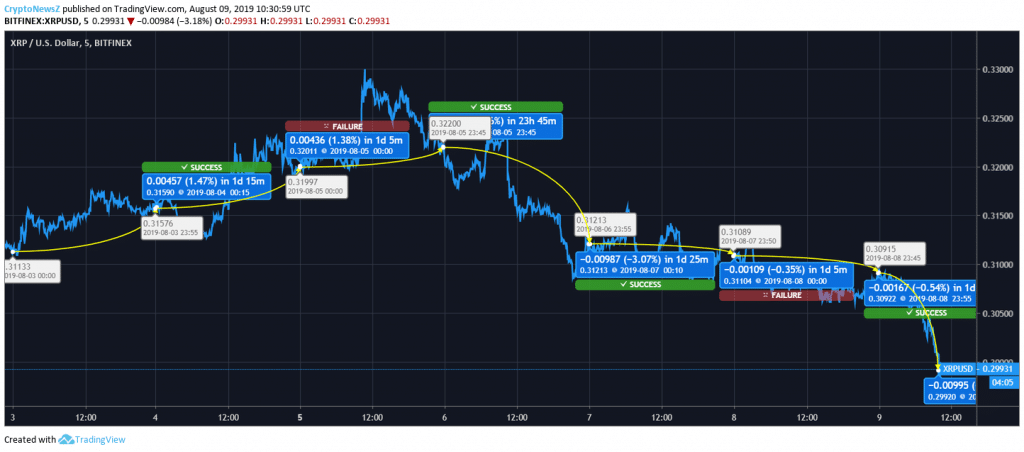
The week-long chart is pointing towards a downtrend in the coin. On 3rd August, the coin marked an escalation of 1.47%. The Ripple price counters switched from $0.311 to $0.315. On 4th August, the escalation continued, and the change in price was from $0.315 to $0.319 by 1.38%. On 5th, the coin took another jump from $0.319 to $0.322. This time the uptrend was of 0.45%.
However, XRP price started trembling from 6th August as it slipped from $0.322 to $0.312 by 3.07%. On 7th August, the xrp coin dropped from $0.312 to $0.310 by 0.35%. On 8th August, the regression continued. The Ripple coin slipped by 0.54% from $0.310 to $0.309. Today, the coin changed the xrp price counters from $0.309 to $0.299.
The future prospect holds high hope of improvement. The long-term investment plan is recommended for the coin.
Litecoin (LTC)/ USD Price Analysis:

Litecoin (LTC) was trading at $86 at 10:36 UTC. The market cap of the coin is at $5,602,665,425. The coin has shown great potential in the ongoing month. We are expecting a speedy recovery from the coin.
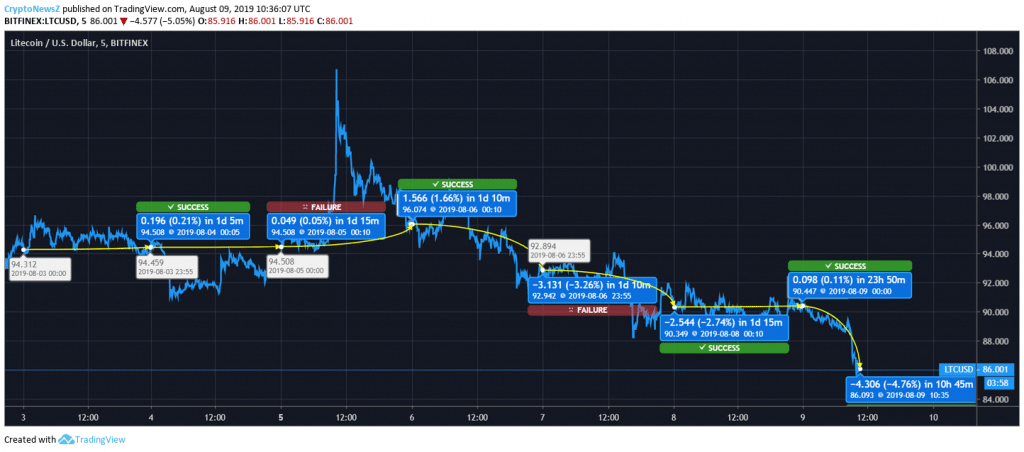
The chart is reflecting a regression in the coin. The week started with the coin trading around $94.3. The coin kept it almost the same as the closing price was $94.4. Day 2, the coin again remained the same. The price changed from $94.4 to $94.5. Day 3, the coin escalated from $94.5 to $96. Day 4, the coin slipped from $96 to $92 by 3.26%. Day 5, the downtrend continued, and the price switched from $92 to $90. The regression was of 2.74%. Day 6, the coin switched from $90.3 to $90.4. The coin kept it same but today the coin slipped from $90.4 to $86.0.
Litecoin (LTC) is a coin with great potential, and it has grown fabulously since the start of 2019 until now. Many marketers believe that Litecoin is the future anchor of the altcoins. The investment in the coin would not go futile.
Ethereum (ETH)/ USD Price Analysis:

Ethereum (ETH) is the second-largest coin in the market. After Bitcoin, Ethereum maintains its dominance. The ETH price was raving in the market from past few days, but today ETH fell on its knees.
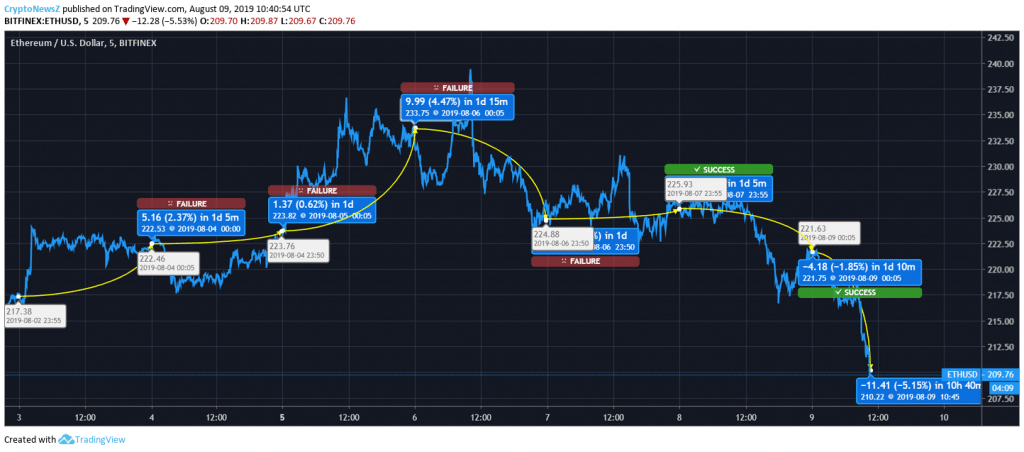
The chart is reflecting a downfall in the trading price. On 3rd August, the coin marked an uptrend from $217 to $222. The escalation was of 2.37%. Next day, the Ethereum price jumped from $222 to $223 having a slight upsurge of 0.62% only. On 5th August, the escalation was of 4.47% as the price switched from $223 to $233. On 6th August, the ETH price started falling again. The downtrend was of 2.06% as the coin slipped from $233 to $224. On 7th August, the coin marked a slight escalation of 0.50%. The Ethereum price changed from $224.98 to $225.93. On the other day, the coin marked a downtrend of 1.85%. The price changed from $225 to $221. Today, the coin took a tremendous drop of 5.15%. The price of Ethereum went down from $221 to $210.
The investment in the coin is result-yielding. We are quite sure that the long-term investors would be seen drawing colossal amount from the token.


