Stellar Lumens (XLM) Price Analysis : Exploration of Stellar’s Sturdy Market Trend

The Stellar network is a blockchain based distributed ledger network which connects financial sectors, payment systems and people which facilitates low-cost cross-asset transfers of value. Stellar’s cryptocurrency is called Lumens and id denoted with symbol XLM. Stellar is operated by a non-profit organization and was introduced as a cross border transfer and payment system that connects financial entities. This network reduces transaction costs and time lags significantly. Each transaction is charged a standard fee of 0.00001 lumens. Its primary focus is on developing economies in remittances and bank loans especially for those who are outside the scope of banking services.
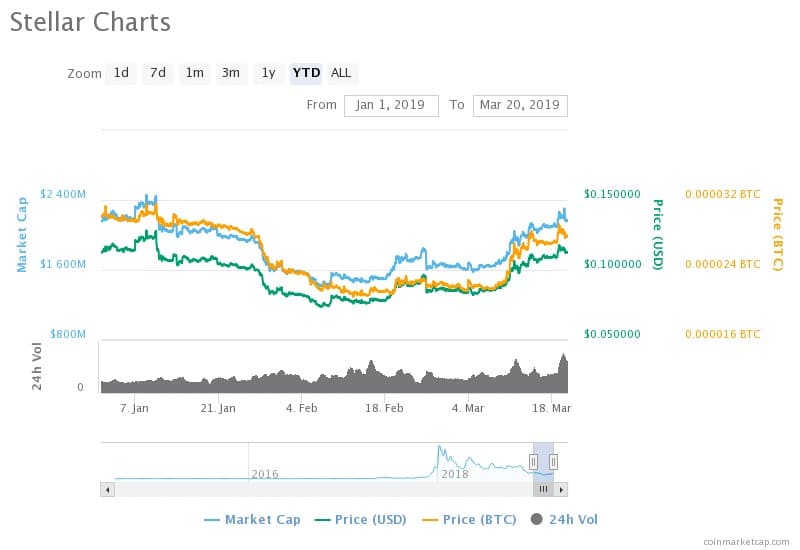
According to the stats from Coinmarketcap, Stellar is ranked as the 7th largest cryptocurrency in the market, and it’s market cap value traded at USD 2,172,821,478 as on March 20 at 15:14 UTC. This is based on its circulating supply of 19,223,803,419 XLM coins. The exchange price for the digital currency is $0.113028. Its current value has increased by 52.62% compared to the MCap value as on February 08, where the market cap value hit the lowest of $1,423,646,928 from the beginning of this year. The values have been wavering drastically over months. However, the cryptocurrency saw its all-time high on March 19 where its MCap value hit USD 2,264,663,348. The numbers have been dropping negligibly. Nevertheless, the 20-day EMA shows a positive sign. There has been a notable rise in the MCap value of 32.02% between the current value and the value of USD 1,645,871,562 on February 28, 2019, at 22:34 UTC.
Coinmarketcap has been observing and have provided the pricing of this digital currency. The corresponding price of USD and BTC are $0.113028 and 0.00002796 respectively, and its 24h volume is 249,275,147 as on March 20 at 15:14 UTC. An analysis shows that values and prices of BTC, USD and MCap have been evolving distinctively. The price of BTC altered drastically between February 01 and March 19. The numbers went as low as 0.00002124 on February 19 and rose as high as 0.00002926 on March 19 with a 37.76% hike. Since the rise, the price of BTC has been range bound. However, the USD has been on an uptrend after its drastic downfall. It has been parallel to the MCap values and has been sharing its highs and lows. The price of USD, along with the market cap reached the all-time low on February 08 with the value of 0.074270 USD and high of $0.117824 on March 19, with a positive percentage difference of 58.64%. The price of USD reached a milestone between February 18 and February 24 when it went uphill from $0.079083 to $0.096577 with a massive 22.12% growth in 06 days.
The 14-day average is also in sync with a rise of 31.99% in the MCap value of USD 1,646,221,287 from March 06 at 23:39 UTC. Since the moving averages are on an uptrend currently and their percentage differences are significant, the bulls have the upper hand. These results show that the market balance is tilted in favor of buyers both long term and short term. Hence, as per Stellar Forecast, investors and traders should move forward with their investments to earn huge benefits. The stability in the increasing trend will work beneficially in terms of profit.


