

- Stellar, at the time of penning down this analysis, was trading at $0.0624 against the US Dollar as the price accumulation takes the toll
- The intraday price of XLM coin has rebounded from $0.060 to $0.062, which helped retain support from 50-day and 200-day daily MA
- Recent intraday price recovery has led XLM/USD to draw an uptrend with a bullish crossover of MACD on the half-hourly chart
- Stellar Lumens, to break the overall downtrend that is seen drawing over the past two days, it must break the strong resistance at $0.0650
Stellar Price Analysis
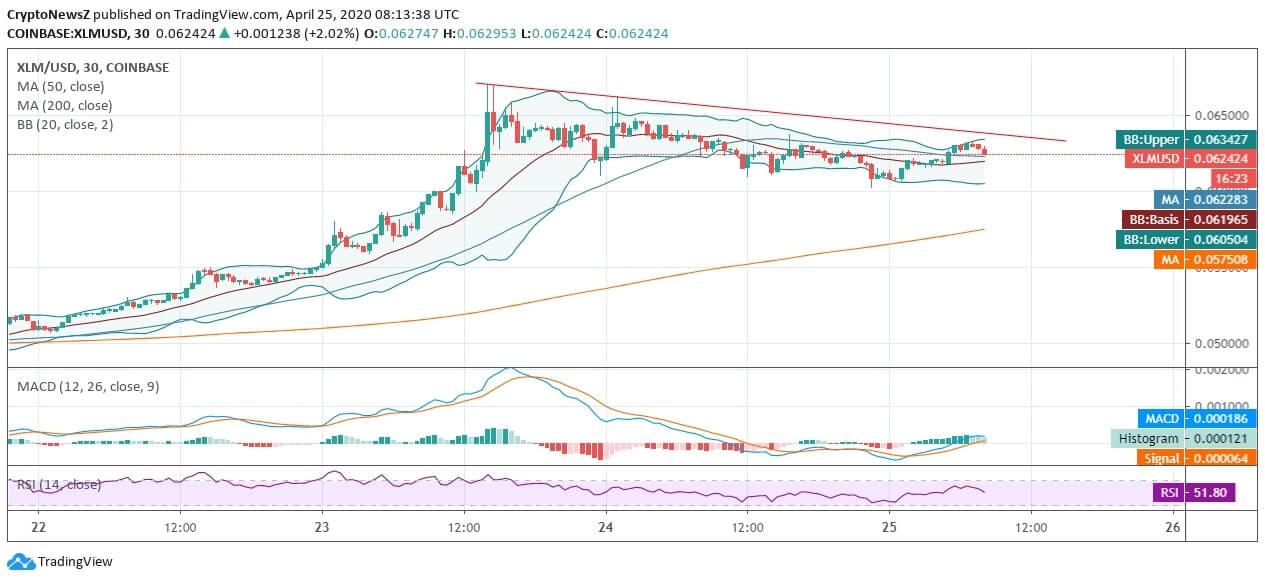
Analyzing the half-hourly chart of Stellar against the US Dollar, we see that the price trend is drawing a fine downtrend yet appears accumulating on the intraday basis. In today’s trading session, XLM coin has gained a notable momentum to rise from daily support of $0.060 to currently trade around $0.0624 with steady support. However, if the candlestick faces a trend aversion, the coin is likely to lose support from 50-day daily MA. Moreover, the trend of the coin is hitting around the upper 20-day Bollinger Band with the gained intraday traction.
The intraday momentum has led the XLM coin to hold a bullish divergence as the MACD line crosses above the signal line, which otherwise was bearish over the past 2 days. Similarly, the RSI of Stellar is seen inclining towards the overbought region at 51.80.
On the upside, the major resistance to watch out for lies at $0.065 as per the current momentum of Stellar and on the downside the daily support, i.e., $0.060, followed by $0.057, which happens to be the 200-day MA is the major support to observe. According to our XLM predictions, the coin might mark slight correction in the upcoming days before crossing $0.063 mark.