Stellar (XLM) Forms a Bearish Trendline After Surging Above $0.061

- Stellar has struck a rebound on November 25, currently consolidating
- The coin needs to trade above $0.059 to break the bearish impact
- The price surge on November 22 has corrected down strongly
- Technical indicators are yet to show any positive sign
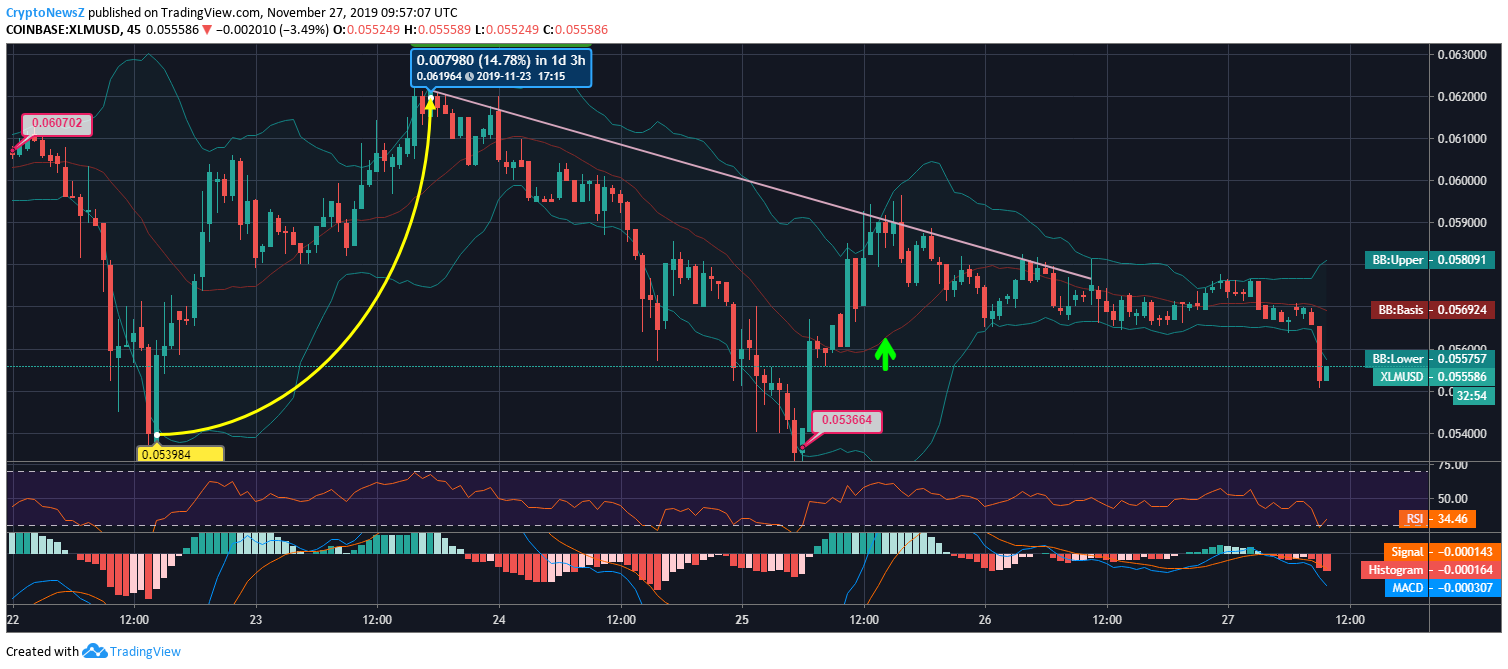
XLM coin’s 5-day price movement looks volatile as it traces two major plunges along with an escalation above $0.061. Since yesterday, Stellar price is consolidating at $0.056, and recently the coin has formed a bullish candle. Notably, Bitcoin’s price has just breached the key support level of $7000, and it is to be seen how it affects the altcoins.
5 days ago, the XLM coin held a bearish trend due to which the price declined to $0.053. With a rapid price move, the price rose to $0.061, with an increase of 14.78%. As it faced rejection there, Stellar traced a bearish trendline while noting a major price fall at $0.053. the coin has managed to recover from the low as it reached $0.058. Currently, the XLM price is consolidating at $0.055 at 09:57:07 UTC.

On the basis of the above-mentioned chart for the XLM price forecast, it can be derived that the Bollinger bands are opening wide, noting a volatile price movement, while the XLM coin has formed a bullish candle recently, which is likely to start a rebound. RSI, on the other hand, is approaching 30, showing an oversold phase. MACD chart is also in the bearish zone with its MACD line on the downside.
Stellar Lumens is likely to see resistance levels at $0.0595, $0.0606, and $0.0621 and support levels at $0.0570, $0.0554, and $0.0544.


