

Tezos, one of the top 20 cryptos of the global market, is seen breaching the downtrend with an intraday bullish candlewick outbreak around the $2 price area leading to a slight positive crossover over the past five days. XTZ coin, at the time of writing, was seen trading slight above $2 and $2.05, wherein the coin grew from 7-month support marked at $1.78 after a gradual pulldown from the YTD high.
Moreover, Sygnum, Switzerland’s bank, has now become the first bank to initiate Tezos staking with stake rewards of up to 5% annually. The bank’s clients can reckon on the bank’s independently confirmed tax impact assessment reports, which are accessible on-demand through e-banking.
This scalable smart-contract platform is holding an ingenious governance model that ensures stability with regular upgrades and evolution. Alongside, this Switzerland conducts a comprehensive inspection of the selected group of Tezos validators offered on its platform.
With the smart-contract platform gaining enough traction, the price of XTZ has been on a roll over the past five days now, and in this regard, Tezos was the coin of the day as per LunarCRUSH Social Listening for Cryptocurrencies. The price strengthened and the coin breached above $2 with 66% bullish sentiment.
Tezos Price Analysis
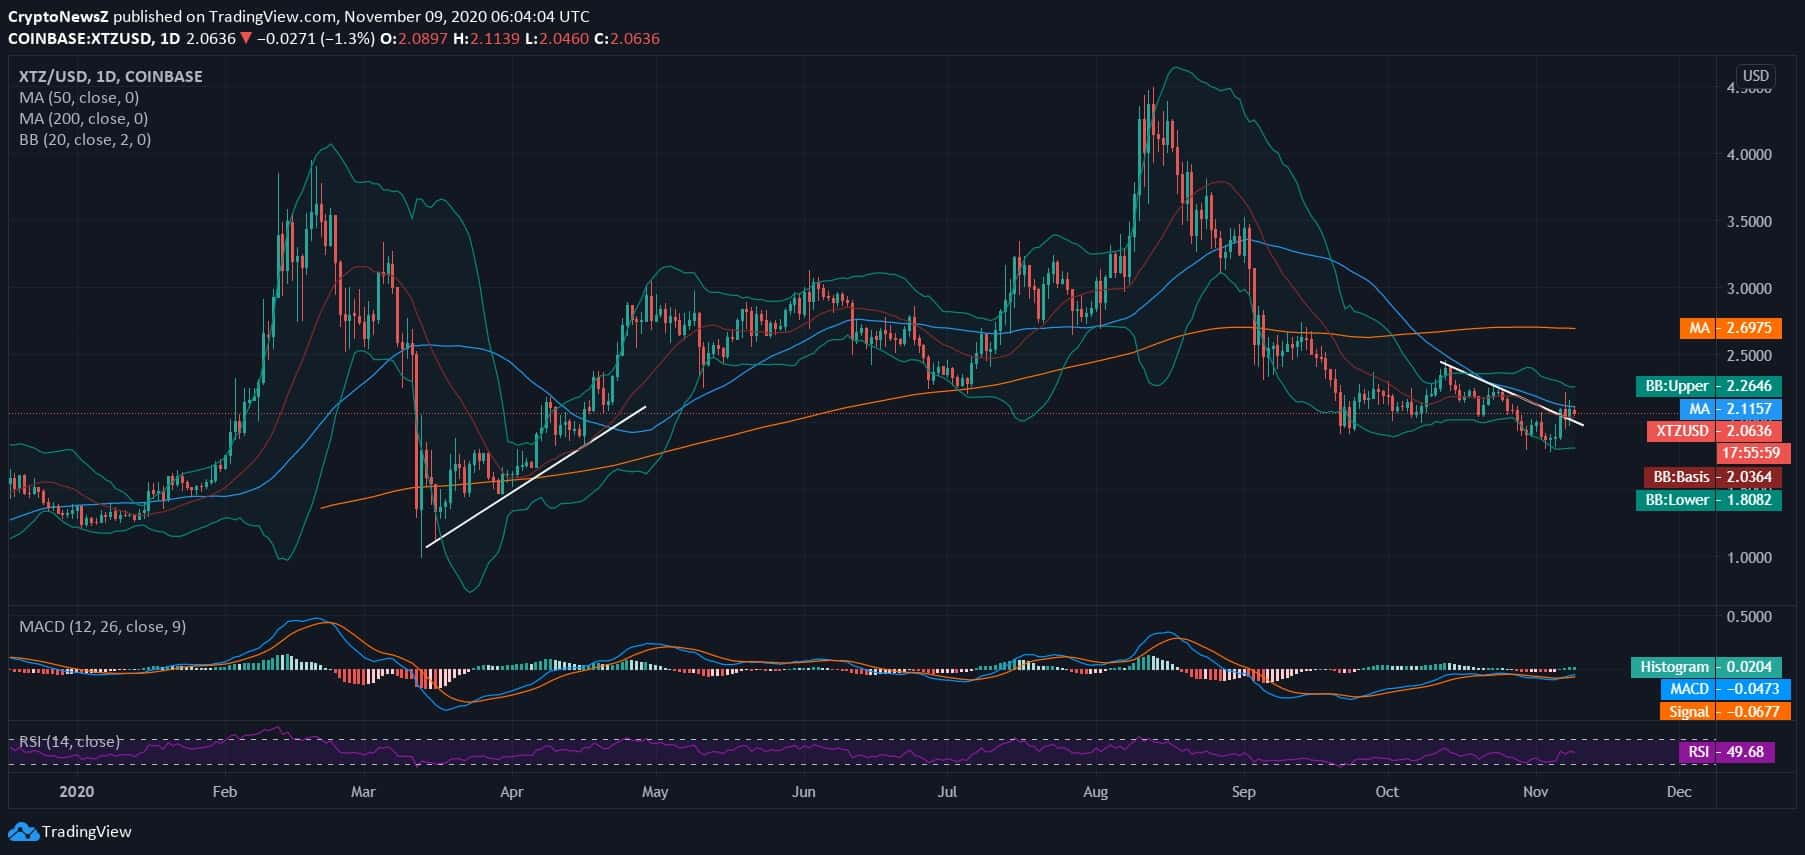
Tezos continues to trade above $2 after a 4-hour spike in the price. However, the price pulled back slightly from the daily high of $2.14 and currently trades at $2.06. It was since the 2nd week of the previous month when XTZ/USD was seen drawing a notable downtrend against the greenback. With the intraday gain in price, the candles are seen inclining towards the upper Bollinger Band on the daily chart but lack support from the daily 50-day and 200-day MA lying at $2.11 and $2.69, respectively.
Moreover, if we emphasize on the daily movement of Tezos over the past 10 months, we see that the coin has been trading with a volatile momentum. The MACD chart reflects a slight bullish divergence after the price spurred from trading below $2 to currently trading above $2. The RSI is lying at 49.68 and has risen from lying around support and oversold region to moving towards the overbought region. According to the long-term Tezos price prediction, the XTZ coin might reflect a recovery in the upcoming weeks and cross its previous resistance of $2.5.