Trade Opportunity with Stellar Lumens (XLM)
XLM on the Verge of Potential Reversal

The lumen is the protocol token of the Stellar network. Lumen is abbreviated as XLM across all Cryptocurrency Exchanges. Stellar is an open-source and decentralized protocol where one can transfer any pair of currencies across the border using XLM as a native token.
XLM Price Analysis
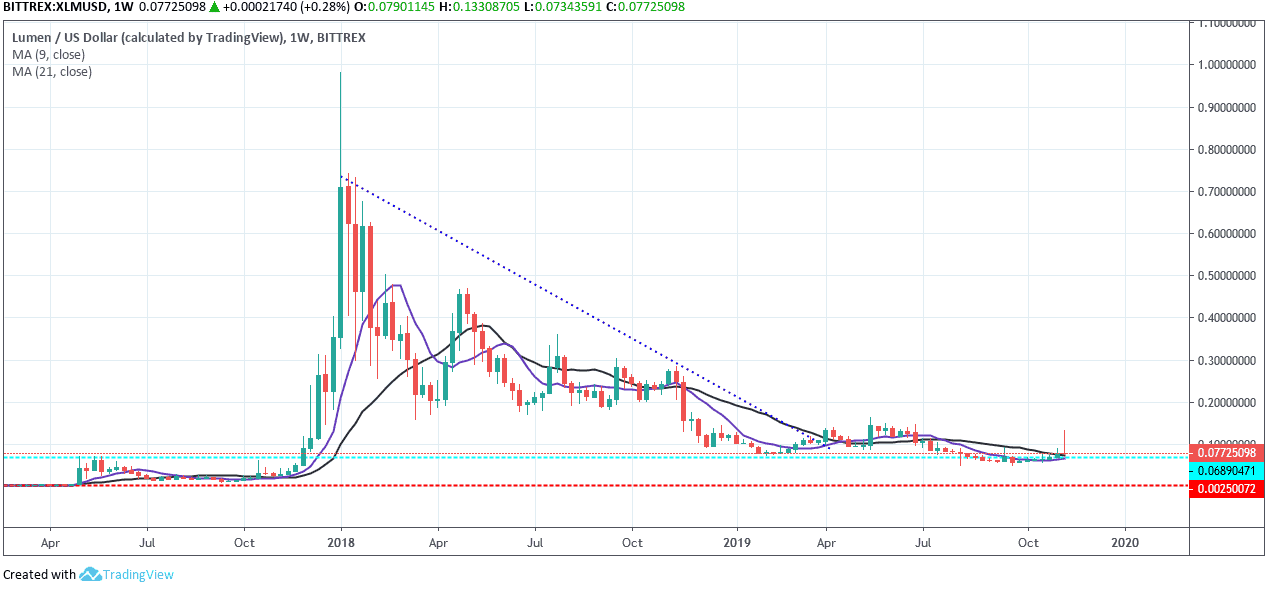
Let’s study what we found out using the Stellar Lumens prediction chart across 1 Week and 1 Day Time Frame:
*Data is provided by TradingView and Bittrex

- Prices are back to Key support level, represented by the Blue dotted line at 0.0689, and Critical support is at 0.0025 represented by the Red dotted line.
- The downtrend, which started after January 2018 Bull Run, has ended, and from here, we can observe the new trend forming.
- Prices are above 9 SMA (Simple Moving Average, solid violet line) and 21 SMA (solid black line).
- Prices do an S/R flip of Key Support, which itself is a good sign.
Conclusion: 1 Week Time Frame clearly shows that the prices are back to the basics, and it is a good time to add XLM on your Blue-Chip Crypto Portfolio.
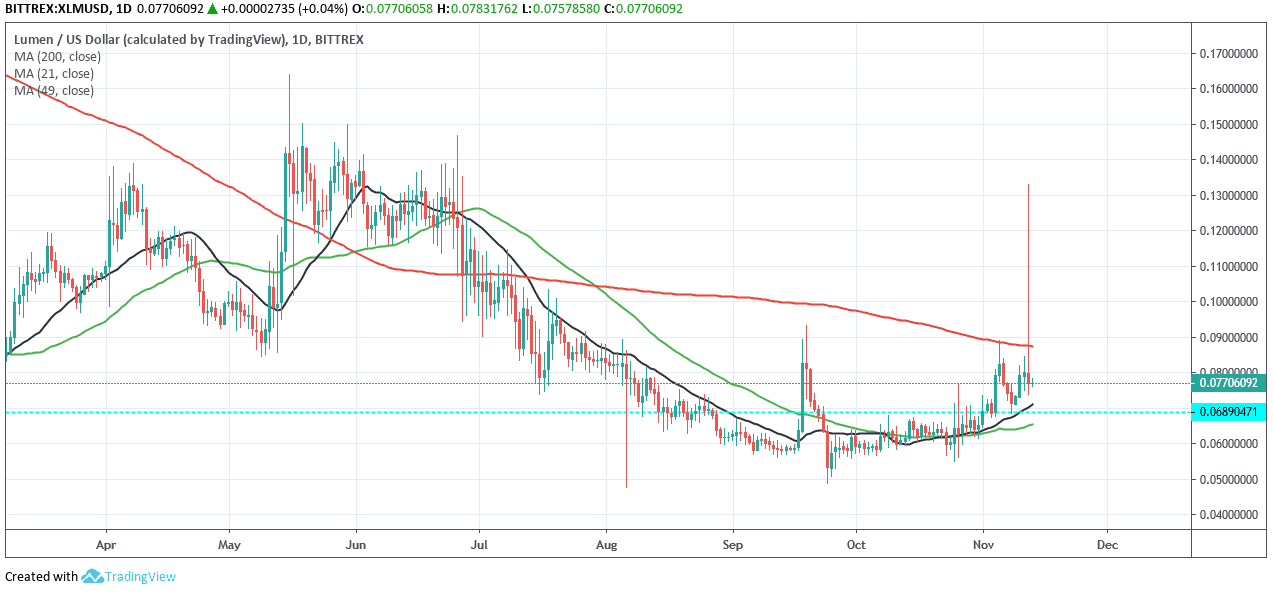
Now, for further analysis, let’s try to understand Stellar price action using a 1 Day Time Frame.

- Prices are under the 200 day SMA (solid red line), as it tried to pierce through it; thus, we can see a very long wick, but since the Buyers could not support the price action with volume, XLM price fell back below from 200 SMA, i.e., around 0.090 mark.
- 21-day SMA (solid black line) makes a Golden Cross with 49-day SMA (solid green line), which is a small bullish sign, although undisputedly most important Golden cross would be 49-day SMA crossing above 200-day SMA which is yet to happen here. Going by current price action, it is just a matter of time.
- Prices have successfully done S/R flip of Key Support level marked by Blue dotted line at 0.0689 is a good sign, and one can expect that the prices might do a successful S/R flip of 200-day SMA very soon going by the current sentiments.

Going through the same 1 Day Time Frame chart for XLM/USD with Ichimoku Kinko Hyo, we observe the following trends:
- Prices are above Kumo (Cloud), which means it is Bullish.
- Key Support and Critical Support are $0.070 and $0.0654, marked by Senkou span B and Senkou span A, respectively.
- Chikou span (solid orange line) is above the prices and Kumo, thus indicating Bullish momentum.
- Price candles are below Tenkan sen and Kijun Sen respectively thus, indicating short term bearish movement can also be confirmed by Kumo as Senkou span is B above the Senkou span A. (just under the current price; Kumo color is Red)
Conclusion: Though there is a short-term Bearish price movement indication towards key support area around $0.070, prices might bounce from the Kumo resistance and continue its Bullish movement as Price is still above Kumo. Now the question is if XLM coin rises in value after the bounce from the key or critical support, what would be the TP (Take Profit) area for the short/swing trades? Let’s try to decode the same with Fibonacci Retracement Tool in the below given XLM/USD chart.

TP (Take Profit) Areas are as follow:
- TP1: 0.0916 which is 38.2% on Fib tool and it also almost coincides with 200-day SMA (solid Red line)
- TP2: 0.105 which represents 50% on Fib
- TP3: 0.1194 which corresponds to 61.8% on Fib
- Open: As the price can still go above TP3, one can always move their SL (stop loss) as the price goes above TP3.
With TP3 (0.1194) as the final Take Profit, we can have 54.01% gain while putting a Stop Loss at 0.067, i.e., 12.77% just below Key support marked by dotted Blue line in the above and previous charts, we will have R/R ratio of 4.23.


