Tron (TRX) Price Analysis : An Outline on TRON’s Withering Market

Tron is a peer-to-peer decentralized blockchain that aims at connecting the mammoth global content and the entertainment sector. Content sharing is done directly via blockchain avoiding any intermediaries. The creators of digital content receive revenue directly from users and consumers. This also reduces the dependency on various social media sites and hence the traffic is reduced too. Tron primarily aims at spreading the data without any limitations; the users are permitted to upload and store data, videos, and audios through content abled channels. The uploader is set to receive profits of a value proportional to their contribution. Tron mainly focuses on individuals than organizations. The Tronix transaction model is called UTXO, where a set of rules help unlock a specific set of the amount that has been sent through TRON. TRX denotes Tron coin.
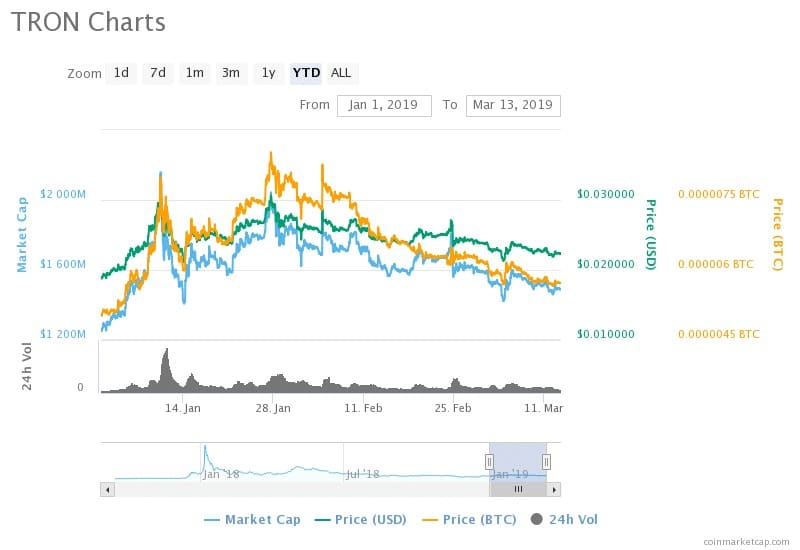
Based on the reports from CoinMarketCap, TRON (TRX) is the 10th largest cryptocurrency with its market cap value as $1,488,807,760 USD on March 13, 2019 at 15:19 for the corresponding 24h volume of $91,610,359 USD which is relatively lower by 14.15% from the value of $1,734,177,257 USD on February 11 at 13:34 UTC. The overall market has been on a downtrend with inconsequential highs and lows. It traded as low as 1250 million USD and reached a peak of 2140 million USD in January 2019 before the setback. The current market value is its lowest MCap value. The downtrend of the market trend is exhibited by the decrease in current value from its all-time high on January 10. The percentage decrease is 30.43%. The 20-day Exponential Moving Average also shows that the downsizing market, with its values dipping from USD 1,657,706,240 on February 21 to the current value by 10.19%. The declining values push the digital currency into bearish pressure.
The price of TRX/USD pair is $0.0022327, and that of TRX/BTC is 0.00000572 as on March 13 at 15:19 UTC. Based on the analysis by Coinmarketcap, the data about the trading moment of price and Market Cap value has been deducted. The reports show that the price of BTC had been ruling the market before the price of USD overtook; however, the MCap value is beneath both the prices. The MCap values and the price of BTC had merged on January 07, 2019 and after which the Bitcoin’s price took the lead. The price of USD was at a peak with the MCap value on February 24 with a value of USD 0.026884, and the price of BTC was high on January 27 with a value of 0.00000852. The prices then started deteriorating. While BTC had a decreased percentage of 32.86 from its peak value, USD decreased by 16.95%. The prices have almost been static and linear briefly. There have been many insignificant dips and rise with prices being range bound. Nonetheless, the cryptocurrency reached its milestone between January 21 and January 27, when price rallied from $0.023822 to $0.030666 with a 28.73% increase in 6 days.
The 14-day moving average shows values descending from USD 1,611,836,147 on February 27 to the current value by 7.63% decrease. With both the averages on a downtrend, the bearish pressure exerts on the cryptocurrency. Hence, investors with long term investment plans would find the market, not in favor of them. The traders with short term investments will have to observe the market trend before investing. If there is an uptrend, it will turn out advantageous for the traders, and they will attain more benefit from it. However, find more details about TRX Forecast to know the price updates for upcoming years.


