Verge Price Reflects Bullish Trend; Expected to Close With Intraday Profit

- Verge embarks a bullish trend with its intraday price movement.
- The mixed movements in the price add adventure to the trading.
The crypto market is moving in a distinctive pattern, and the price trends of the coins are also highly fluctuating. Amid the fall and pick-up, Verge is moderately booking upsurge in the price. The ongoing week is reflecting an uptrend in the price whereas the beginning of the month was quite disappointing.
Yesterday, the coin was seen touching a high at $0.003952 and a low at $0.003695. Let’s have a look at the current trading price chart of Verge.
XVG to USD Price Analysis:

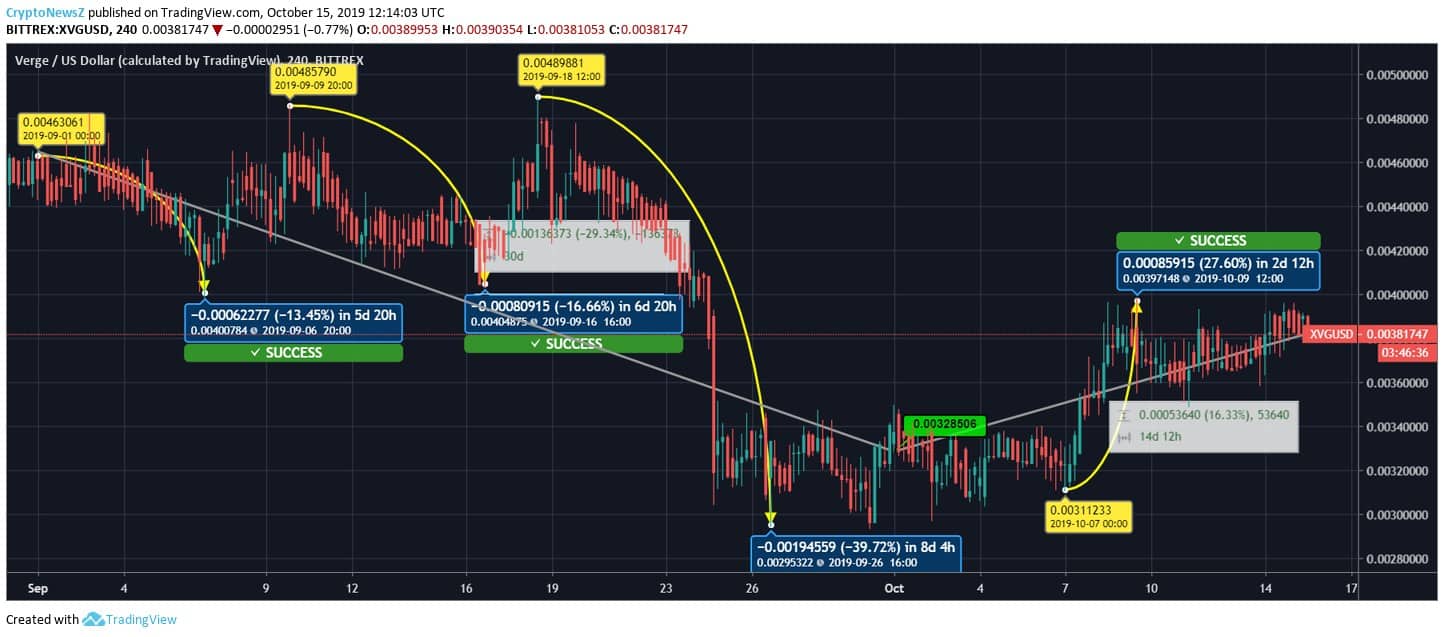
The price chart reflects a V shape movement in the past 45 days. Starting from the month of September, the price moved from $0.0046 to $0.0040 by 13.45%. Later, the price improved but again fell from $0.048 to $0.040 by 16.66%. The price experienced yet another slight recovery but soon booked a tremendous fall. The price counters moved from $0.0048 to $0.0029 by 39.72%. The price movement during the month booked a loss of 29.34%, and the coin closed at $0.0032. The ongoing month is reflecting an uptrend. The major movement was noted when the price escalated from $0.0031 to $0.0039 by 27.60%. In the last fifteen days, the price moved up by 16.33%. The current price is at $0.0038. Find more information about Verge predictions from our forecast pages.
Here is the chart of resistance and support levels calculated:
| Resistance Level | Price | Support Level | Price |
| R1 | $0.004013 | S1 | $0.003756 |
| R2 | $0.004111 | S2 | $0.003597 |
| R3 | $0.00427 | S3 | $0.003499 |
The price of the Verge seems to be moving towards the immediate support level. The intraday trading might not be profitable, but in the future, it is likely to give good results. The currency is recommended for short-term traders. The specified period might give the traders huge dividends.


