VeChain (VET) Approaching Weekly Resistance; Bears in Sight

VeChain Thor is a dual token, Blockchain as a Service platform; VeChain’s ticker is VET across the crypto exchanges. Its primary focus is providing Supply Chain and IoT solutions. (Internet of Things)
The market cap of VET is 382 Million USD and currently ranks 26 as per the CoinMarketCap data.
VeChain Price Prediction:
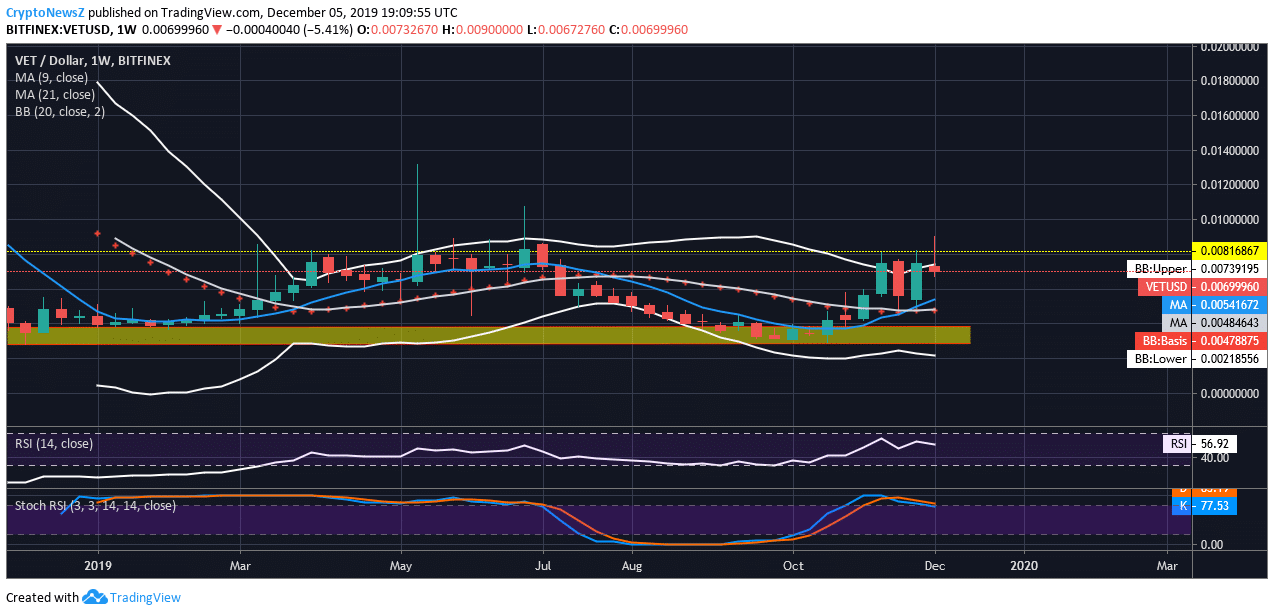
Weekly VET price has been rejected by the resistance represented by the yellow dotted line at $0.00816; previously also it tried to break this resistance around May, June, and July but got rejected. Prices are above 9 days SMA (Simple Moving Averages: solid blue line) and 21 days SMA (solid white line), and currently inverted hammer Candlesticks are formed near the resistance, which is also the upper Bollinger Band limit. VeChain prices may fall back to the mean average of $0.00478. The key support and critical support are at $0.00382 and $0.00278, respectively, represented by the yellow shaded area. Meanwhile, Stoch RSI is in the overbought region. Therefore, according to Vechain Predictions by experts, the prices may go down.

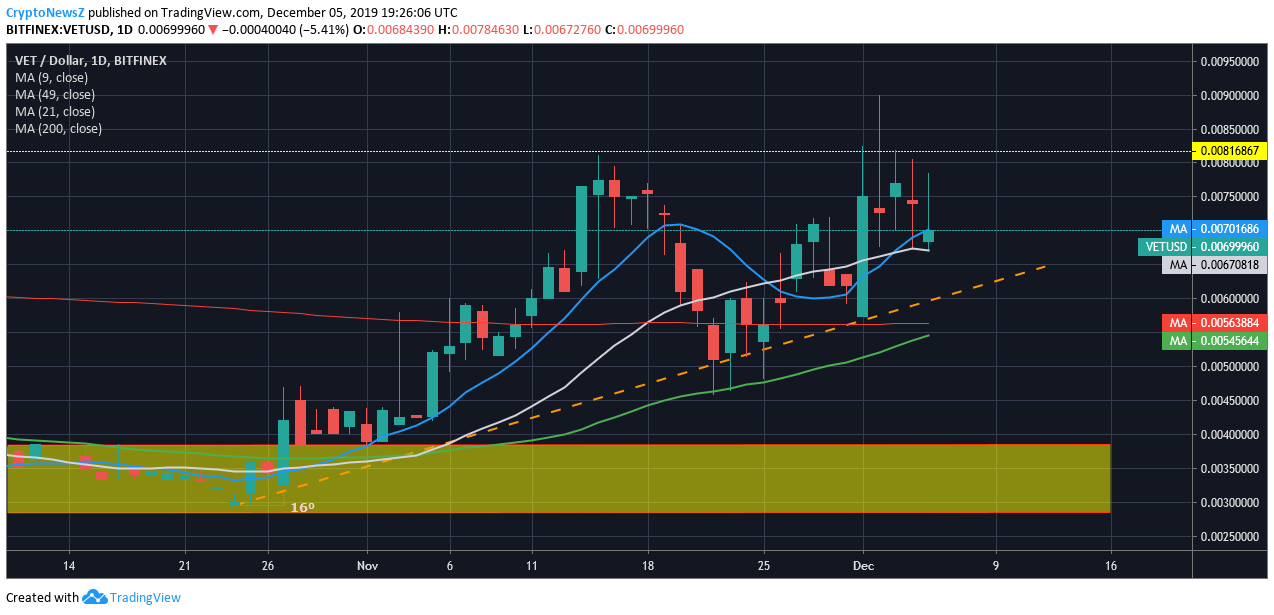
Daily VET prices have been supported by 49 days SMA (solid green line) and still in an uptrend; prices have done a successful S/R flip of 200 days SMA (solid red line) and currently facing weekly resistance at $0.00861. VeChain price is still supported by 21 days SMA (solid white line) and 9 days SMA (solid blue line).

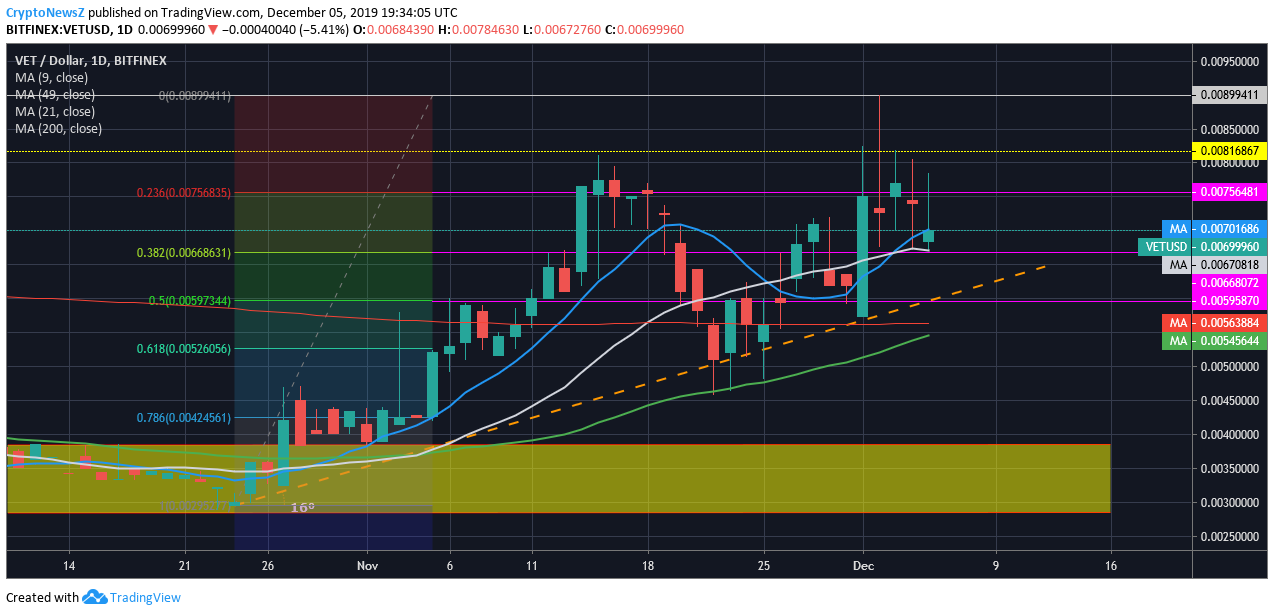
VET Prices are respecting Fib levels as can be seen in the below-given chart, prices dropped below 61.8% Fib level ($0.00526) for the short duration, but it acted as a support, 50% Fib level too acted as a support before its continuation towards the weekly resistance line of $0.00816. At present, daily prices are supported by 38.2% Fib level ($0.00668) and thus making Higher Lows in this process. Since VeChain price is approaching a weekly resistance line, which is acting as ‘The great wall of China’ so far, it would be wise to wait and see whether prices do S/R flip of this weekly level. Stoch RSI is in the overbought region, and RSI is at 55.33. There is still room to grow, and VET prices may go high from the current level of $0.00699 to $0.00816.

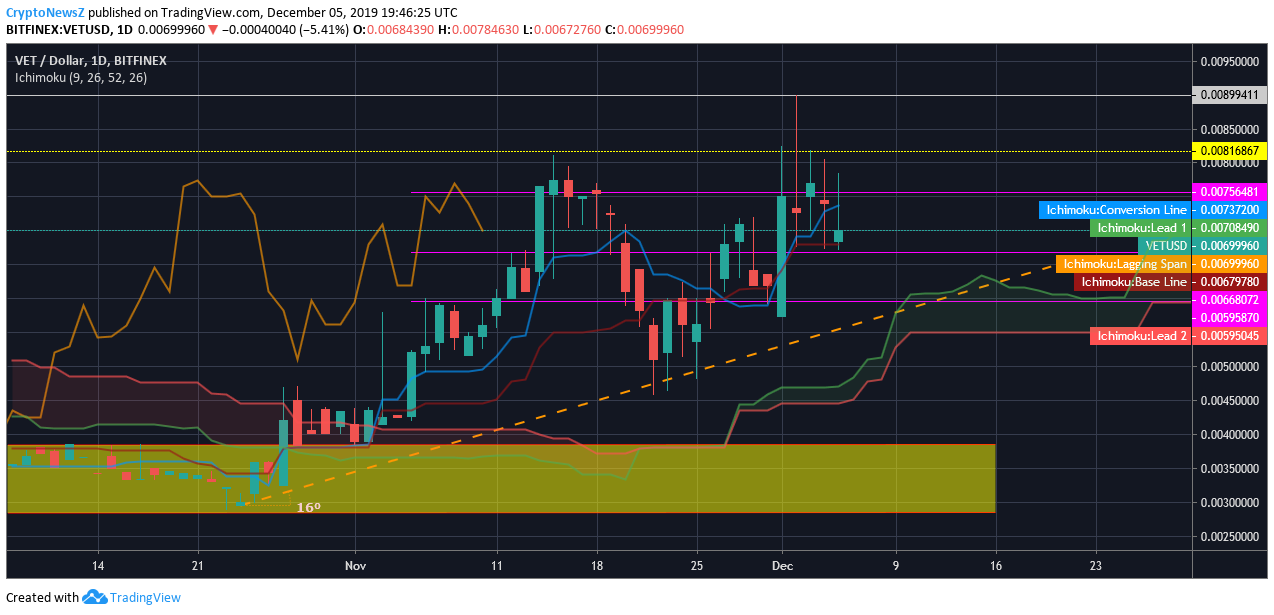
Laying Ichimoku Kinko Hyo over daily chart for further analysis:
- VET price is above the KUMO; Bullish trend.
- Chikou sen (solid orange line) is above the prices and above the cloud; Bullish trend.
- Prices are above Tenkan Sen (solid blue line) and currently supported by Kijun sen (solid red line), and Kijun sen almost coincides with 38.2% Fib level.

Conclusion: Clearly, VeChain price is in an uptrend, making Higher Lows and approaching weekly resistance.


