Will Bitcoin’s Current Trading Price Possess a Threat to Mining Ecosystem?

- Bitcoin price slides below $9,000 and trades at $8,747.51 after having tested the support near $8,500
- As per the latest news, BTC Mining Difficulty dropped by 7%
- 184days left for next halving, will it chase a Bull Run before it?
Bitcoin mining difficulty has dropped to 7%, as per the recent news, and this is the highest drop. All this while until now, since 2019, the difficulty kept rising. BTC has had quite an enticing movement in the bygone previous 2 quarters. However, it currently trades below the highest price mark recorded this year, i.e. $13,000, but trades above the price it started trading in 2019 initially.
Bitcoin difficulty sees a major drop first time in 2019, abt 7%
Mainly due to price as lower end rig has shut down, partially due to end of raining szn, when cheaper excessive hydro is no longer widely available
Many miners will rekt badly if price does not double in halving pic.twitter.com/2guQvPkoHs
— Dovey "Rug The Fiat" Wan (@DoveyWan) November 11, 2019
Due to halving, the old miners of the network seem to surrender and face competition from the new miners. The current price is around the breakeven cost, facing issues with profitability. However, if there have been any new investors in this duration, they would be facing a lack of issues covering their capital. Get more details about the Bitcoin predictions, the current volatility and lack of bullish move in the recent future that will lead the miners to face ultimate losses.
Bitcoin (BTC) Price Analysis:
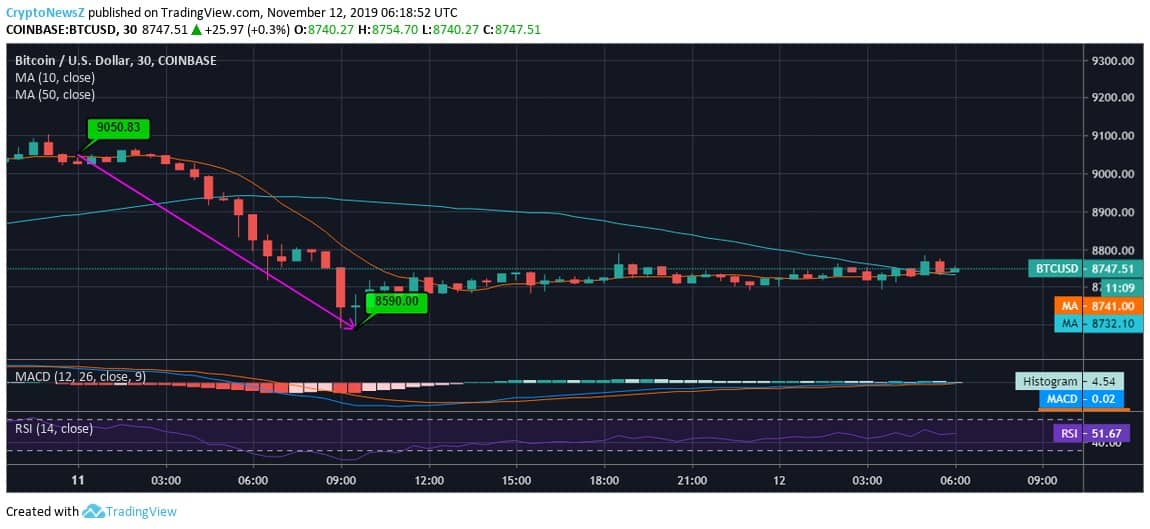
 As per the half-hourly movement over the past 24 hours, we see that the movement of BTC/USD has been quite relaxed after having faced a steep fall from $9,050.83 to test major support at $8,590, yesterday. The downward candle formation has been all in red without any intrusion to trade above $9,000 at any instance.
The following movement from $8,590 until the time of writing has been quite stable, possessing equal green and red candles, while BTC currently trades at $8,747.51. The current trading price of Bitcoin is 3.35% less and 1.83% more than the respective highest and the lowest in the said time frame.
Bitcoin has slid in the ‘sell phase’ and has no immediate support from any of the short-term moving averages around $8,700 price area but is supported by a 30-day moving average. It is later followed by the support around 200-day EMA at $8,698.36 and 50-day MA at $8,534.11.
Bitcoin Technical Indicators:
The MACD of Bitcoin is running bearishly, inclined to zero as the signal line overpowers the MACD line.
The RSI of the coin is at 51.67, having rose from the oversold region and currently exhibits no extremities.


