XRP: Yesterday’s Surge Corrects Down; Price Slowly Recovers

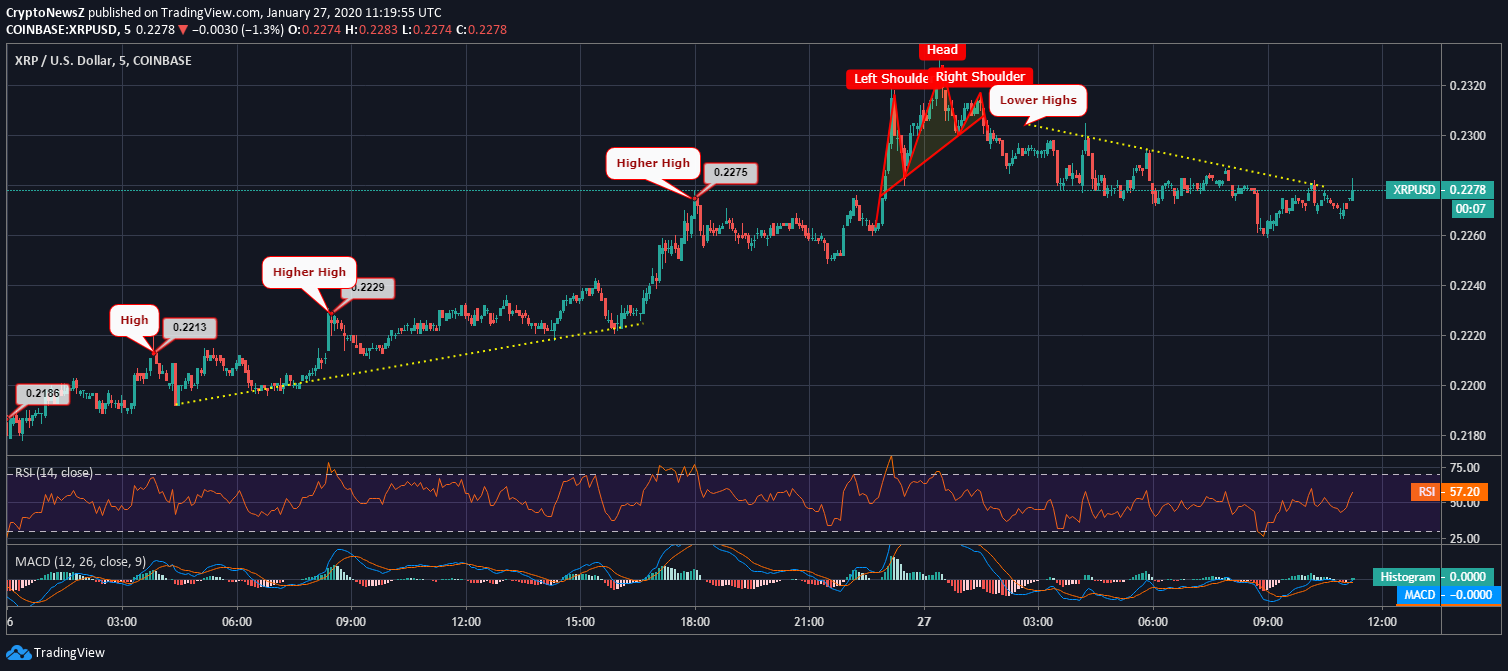
XRP coin’s one-day chart shows how it has been declining since today morning. XRP spent a bullish yesterday, which ended with a head-and-shoulder pattern. The coin has recently started a not-so-vigorous price rebound according to its 4-hour chart.
Ripple Price Analysis
Yesterday, XRP maintained its bullish vibe for a whole day as it formed many higher highs and even traded above $0.23. This can trigger the bull-run further, as predicted earlier. However, in the end, the head-and-shoulders pattern gave a hint of an upcoming pullback.

Since 9:00 UTC today, XRP has not formed any lower-high or lower-low indicating a price recovery. The altcoin at present is mildly bullish but is moving up at a slow pace. Also, the 4-hour chart of XRP to USD confirms the same.
Here, RSI of the coin is at 57.20, showing a neutral phase. MACD is attempting to have a bullish crossover.
Ripple quite sharply dropped to $0.2259 from $0.2286. As compared to its decline, the rebound is time-consuming. The XRP coin has uplifted its support level at $0.2268 while recovering its loss. XRP has faced stiff resistance above $0.2281 twice, which is above the 38.20% Fib level.
The XRP price is likely to have a bullish out above the immediate resistance level of $0.2281 soon if the uptrend remains intact. The same can usher the coin above $0.23. Also, the coin is entering into a volatile zone, according to the Bollinger bands.


