XRP’s Pullback is Yet to See a Reversal; Is the Bullrun Fading Away?

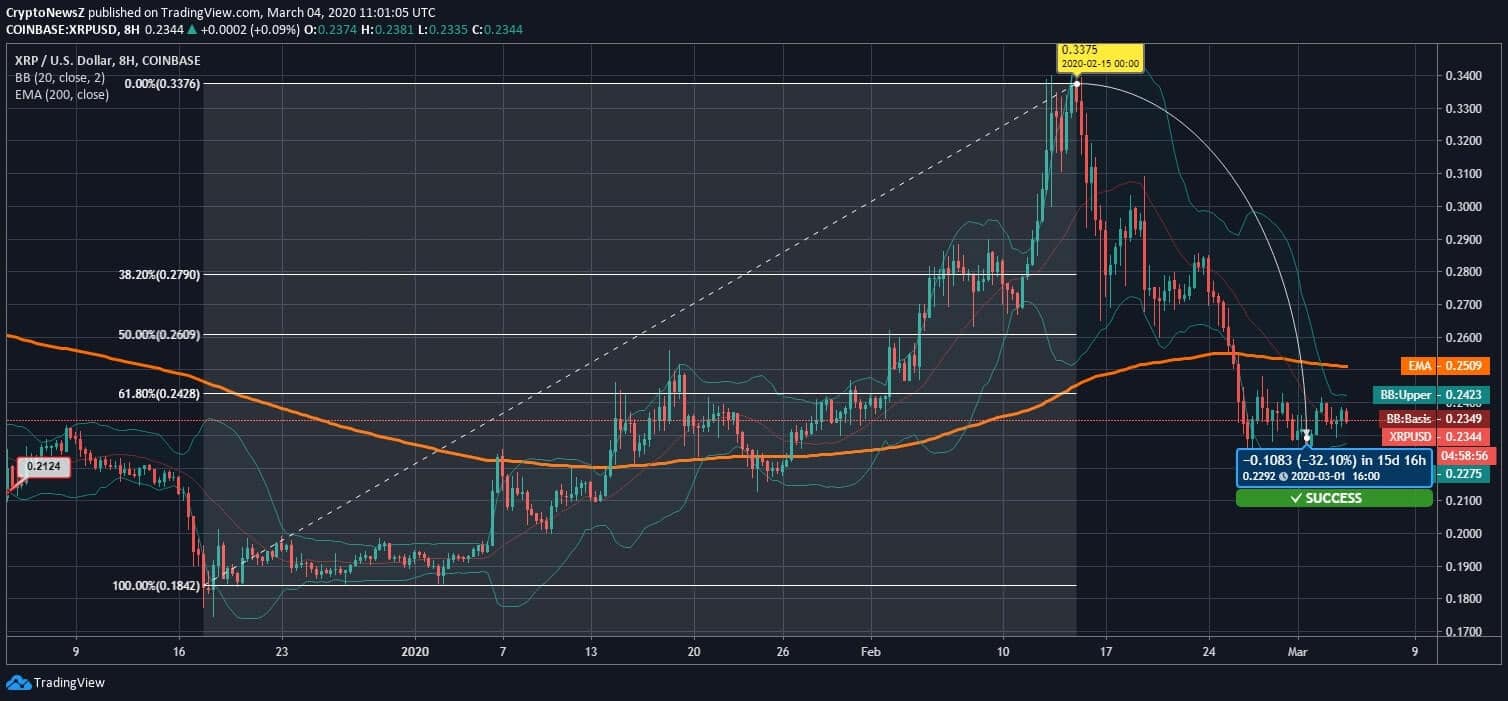
- XRP is down by 32.10% as compared to its price in Mid-February
- The coin is testing support levels near $0.23 at the moment; supports near $0.22 have already been examined
- In its 3-month price chart, the coin is trading below the EMA line noting a bearish phase; also, XRP is between the 61.80% and 100% Fib levels
XRP Price Analysis
Yesterday’s pullback has again ushered XRP below $0.24 and today, it is ranging around $0.23 only. The coin is struggling to strike a bullish spike above $0.24 at the moment. Bitcoin, on the other hand, is consolidating above $8800.
Currently, the coin is just a little above where it was in December last year. In the previous month, XRP went as high as $0.33 but, over time, it has traded downwards with a sluggish approach.

The coin has pulled back by more than 32% which is quite hefty. Bollinger bands are not showing any signs of volatility right now while the coin is already below the EMA line.
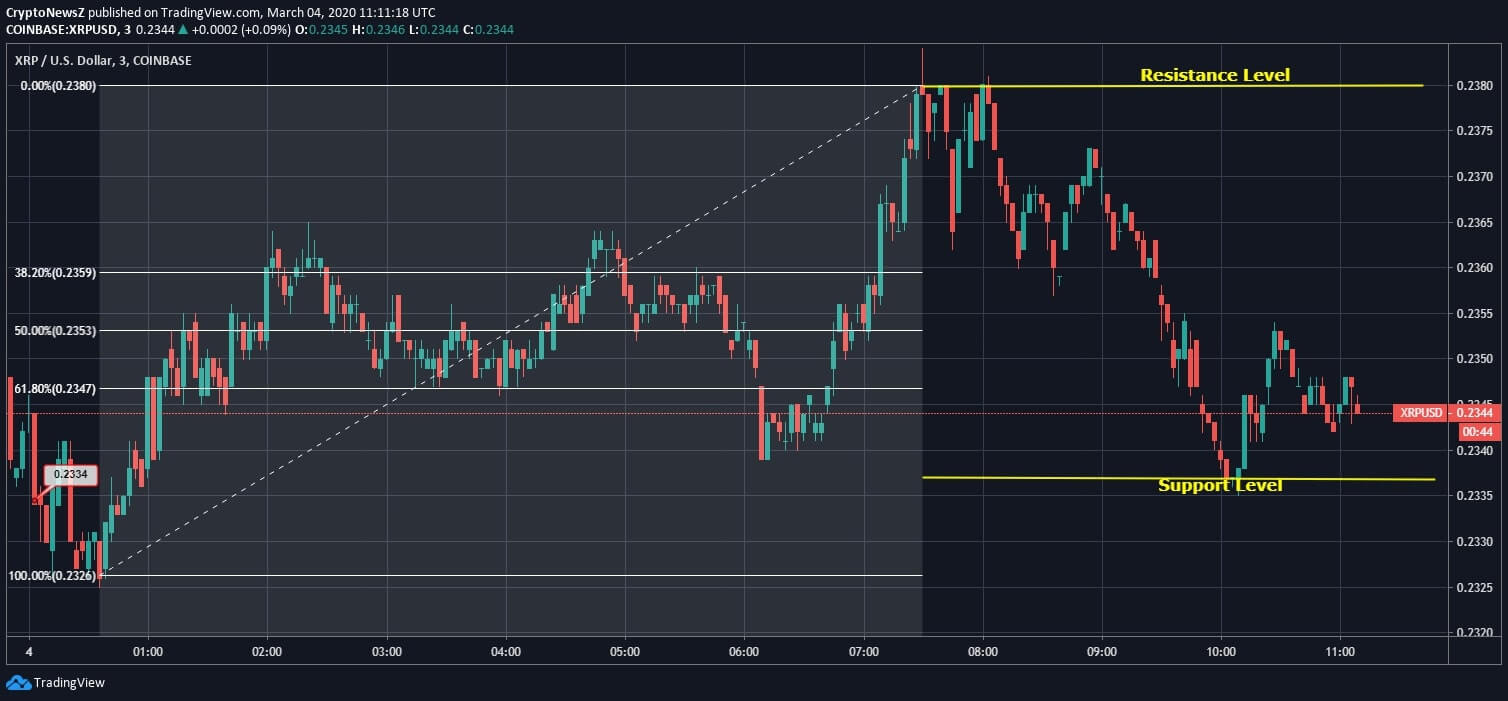
XRP, in today’s chart, shows how it has corrected downwards in recent hours. The coin is ranging between $0.2380 and $0.2335. Currently, XRP price is between 61.80% and 100% Fib levels and its support level also lies below $61.80% Fib level.
XRP has recently faced rejection at $0.2380 and is still holding a resistance level there. It seems the coin needs a strong price boost to shoot up. Apart from the possibility of a further price drop, the ultimate fear regarding Ripple is that it can get range-bound around $0.23.


