





- The Bitcoin price rejecting from $68,000 could force another 3.5% drop before a breakdown below bearish pennant pattern.
- Traders now anticipate the Federal Reserve could delay its first rate cut until mid-2026, likely around July.
- A 20-day exponential moving average continued to act as dynamic resistance against BTC’s recovery attempt.
The pioneer cryptocurrency, Bitcoin, tumbled 2.2% during Friday’s U.S. market hours to trade at $65,978. The sharp pullback followed the release of U.S. Producer Price Index (PPI) which rose 0.5% in January, fueling inflation fear and potential delay for Fed rate cut. In addition, the on-chain data shows a sustainable distribution phase in the market as BTC exchange inflow remains positive. Will Bitcoin price lose $60,000?
BTC Exchange Reserves Climb by 29K BTC as Inflation Fears Resurface
US producer prices rose faster than expected in January with the headline Producer Price Index for final demand up 0.5% from the previous month – beating the consensus forecast of 0.3% and topping a revised December increase of 0.4%. On a year over year basis, the index rose 2.9%, a little shy of the prior results of 3.0% but much higher than expectations of 2.6%.
The core measure, excluding food and energy, picked up 0.8% month on month, the sharpest increase in several months, far ahead of projections of 0.3%, and up from the December figure of 0.6%. This pickup was fuelled mainly by a 0.8% increase in services prices, which was led by a 2.5% increase in trade services margins, including a significant 14.4% increase in wholesaling margins for professional and commercial equipment, which may be a reflection of pass-through effects of import-related costs.
Goods prices, on the other hand, fell 0.3%, which was largely due to a decline in energy and certain types of food.
The US dollar index remained strong above 97.7, buoyed by the high inflation numbers and expectations of further restrictive Federal Reserve policy. Money Markets anticipate at least two cuts this year, the first of which is now expected around July.
In addition, Bitcoin supply across the major centralized exchanges have experienced a steady net accumulation since mid-January 2026. Aggregate holdings increased from 2.723 million BTC on the 14th of January to 2.752 million BTC as of late February, an aggregate increase of about 29,000 BTC and an aggregate growth of about 1% over the period of about 6 weeks.
This accumulation was in distinct phases. Totals briefly rose towards 2.794 million BTC in the opening days of February amid concentrated deposits, before easing back a bit. Toward the end of the month, reserves leveled off at the higher part of the observed band, not retreating to the previous levels at the beginning of the period.
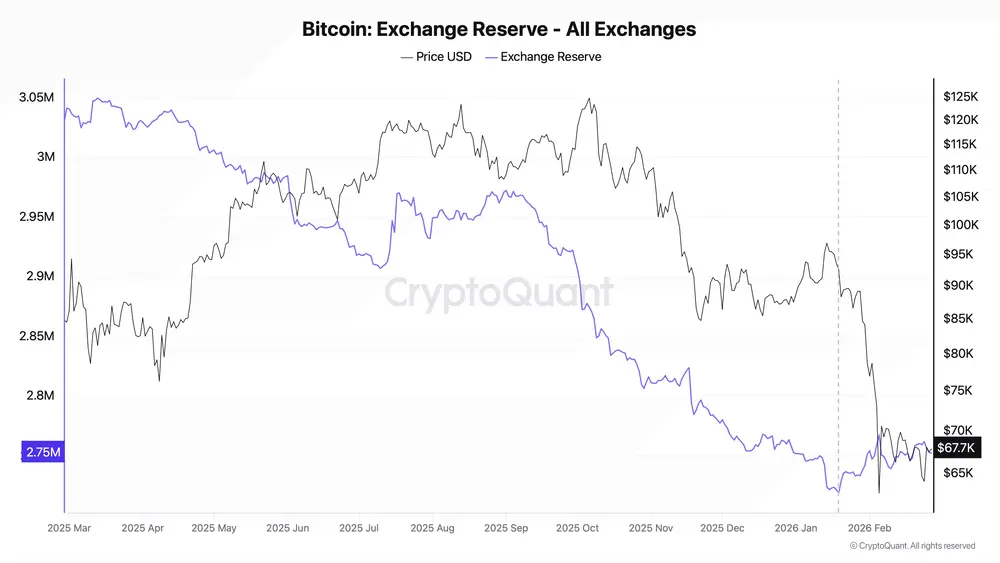
The steady rise here shows inflows have exceeded outflows over the past few weeks, which has slowly increased the pool of BTC that is immediately accessible for selling on the platforms.
Bitcoin Price Could Lose $60k Support Amid Pennant Pattern Formation
The Bitcoin price is down from $68,841 to $66,000 in the last 48-hours, registering a 4.6% loss. This pullback indicates intact overhead supply around the $70,000 resistance zone, pressurizing the asset to drive a prolonged consolidation trend.
However, a look at the daily chart shows that the sideways action resonates strictly within two converging trendlines suggesting the formation of bearish pennant patterns. This short-term consolidation after a sharp downtrend suggests that the sellers could recoup their momentum for the next breakdown.
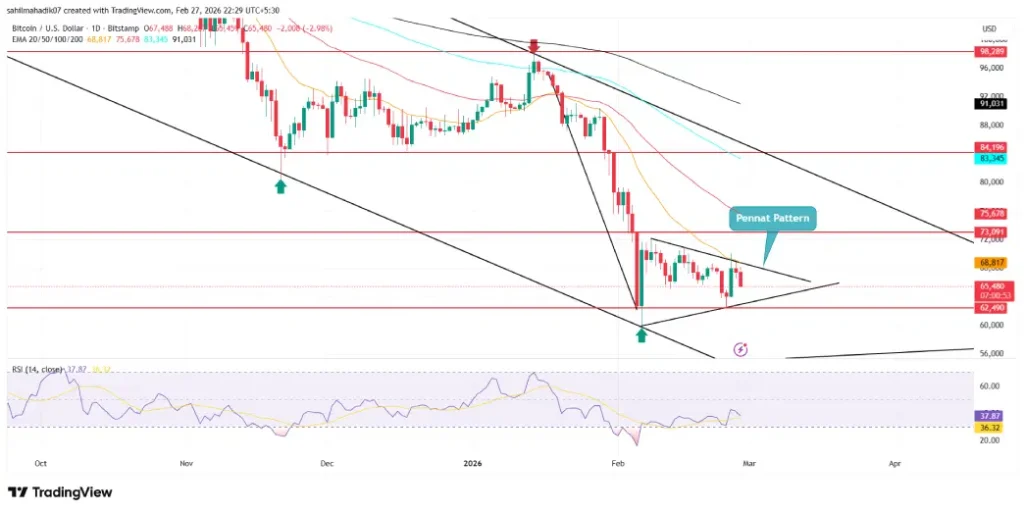
With sustained selling, the Bitcoin price could plunge another 3.5% and breach the pattern’s bottom trendline at $63,745. The post-breakdown fall could push the asset to $56,000, followed by a deeper dive to $50,000.
Also Read: BitSafe CBTC Goes Live with Chainlink on Canton Network

 GoogleNews