

- BTC’s price chart of today shows harsh pullback while the month-long price path shows a gradual growth
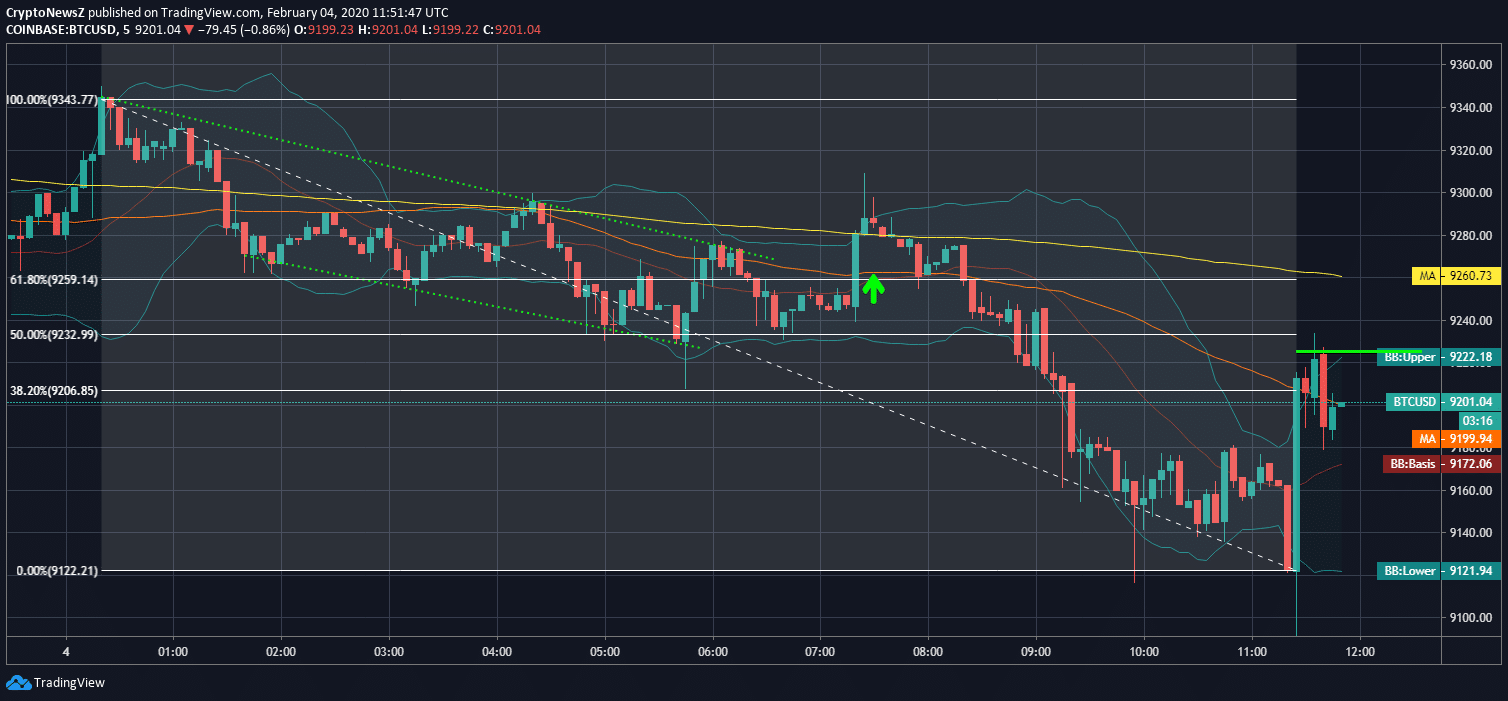
- The coin has started to recover its loss of valuation recently; it traced a close above the 38.20% Fib level and corrected back below the same soon
- Declining flag pattern has been halted; however, Bitcoin still lacks the effectively bullish momentum
- The coin is likely to see volatility while technical indicators are still in bearish territory
- Today’s price pullback has affected the majority of altcoins including the leading ones such as XRP and ETH
Bitcoin Price Analysis
Bitcoin has put the traders under a nail-biting situation today as the coin kept heading downwards till just now. From its pulled-back price level of $9122, BTC price has bounced up to $9201 with a rebound.
The coin was above $9300 when the day opened, and the price correction drove the coin below $9200. Such notable price decline has triggered doubts amongst the crypto community as the decline has affected XRP and ETH to quite an extent. XRP is hassling to remain above $0.25 similar to Ethereum which is yet to start a rebound above $185. You can find more details about Bitcoin predictions at our forecast page.
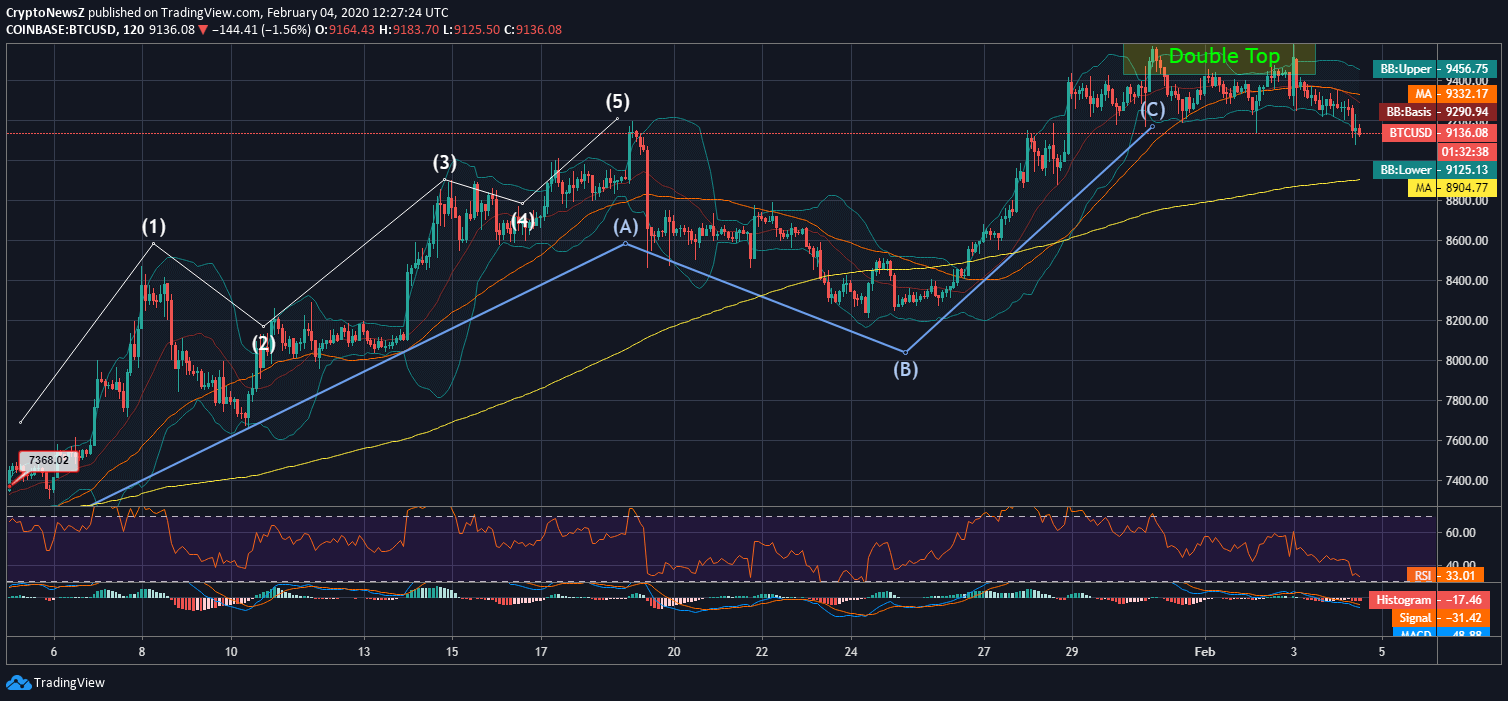
Here, moving averages are bullish for the Bitcoin as the long-term SMA line is above the short-term SMA line. Meanwhile, RSI and MACD are in the bearish territory thanks to the downward correction.