
On Monday, June 23rd, the pioneer cryptocurrency Bitcoin showed a slight uptick of 0.4% to reach $104,447. However, the buying pressure came as a short relief in price amid the continued geopolitical tension in the Middle East, now intensified with the United States joining this conflict. Moreover, BTC’s daily candle showed a higher price rejected wick and deleverage position in the market, indicating the risk of prolonged correction.
Investors Flee Leverage as ELR Crashes to “China Ban” Lows
Over the past two weeks, the Bitcoin tumbled from $110,400 to $104,447, the current trading price, accounting for an 8.3% loss. The primary catalyst behind this correction was military action between Israel and Iran.
The broader market correction further accelerated as the United States bombed Iranian nuclear sites on Sunday morning. Thus, the BTC price flashes a risk of prolonged correction below $100,000.
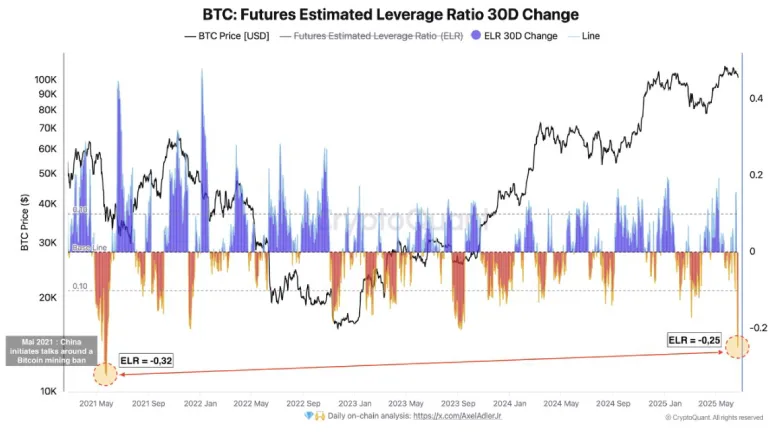
Amid this downturn, the crypto market experienced a steep deleveraging today, as the Estimated Leverage Ratio (ELR) plunged to a level seen during the infamous “China ban” of 2021. ELR is a key metric that reflects the proportion of leverage positions relative to exchange balance. In the last three days, the metric has plunged to the -0.25 level due to the escalating geopolitical tension in the Middle East. The last time the ELR value plunged around this level (-0.35) was when China cracked down on Bitcoin mining in June 2021.
The steep decline indicates that traders are voluntarily closing their leverage positions, also reflected in the sustained drop in BTC’s open interest.
Typically, such a drastic fall in the ELR reflects a bearish sentiment and heightened short-term volatility. However, the CryptoQuant analyst DarkFost highlighted a silver lining, as such panic has historically created suitable opportunities for long-term entries.
Thus, the BTC price could further decline in the near term until the Iran-Israel conflict eases.
Bitcoin Price Tests Major Pivot Floor
Since mid-May 2025, the Bitcoin price has been hovering above $100,000 psychological support as buyers struggle to surpass the $112,000 barrier. This consolidation in the daily chart shows the formation of a traditional reversal pattern called a double top.
The chart setup displays as the letter ‘M’ is often spotted at major market tops and leads to sharp correction trends in the near term. Since last weekend, the coin price has shown a long-tail rejection candle at the neckline support, accentuating the active conflict between buyers and sellers at this pivot level.
If the pattern holds true, the BTC price could breach the 100k floor and signal for continued correction. The post-date downfall could push the price to $93,375, followed by a deeper dive to $88,500.

On the contrary, if a potential bullish reversal breached the 20-day EMA (Exponential Moving Average), the buyers could recuperate bullish momentum and rechallenge the all-time high resistance at $112,000.