






- The Bitcoin price to end its seven weeks consolidation within the formation of symmetrical triangle pattern,
- Crypto analysts highlighted balance shifts that initially appeared to signal aggressive large-holder buying.
- The 200-day exponential moving average at $100,000 accented a key resistance against current market upswing.
The pioneer cryptocurrency Bitcoin jumps 1.78% during Friday’s U.S. market hours to trade at $90,268. The buying pressure likely raised as positive sentiment amid the new year celebration. However, the latest on-chain data highlighted by crypto analysts shows that the price surge lacks whale accumulation as falsely claimed by other market observers. Will the Bitcoin price lose $90,000 again?
BTC Whale Surge Misread as Coinbase Reshuffles 800,000 Bitcoin
The first 48 hours of 2026 has been notably bullish for the cryptocurrency market accentuated with Bitcoin rebound above $90,000. Amid this jump, some crypto enthusiasts took it X (formerly twitter) to highlight whale accumulation.
Recent advances in the interpretation of data on Bitcoin have led analysts to debate. A figure known as Darkfost from CryptoQuant emphasized what looked to be significant purchases of large holders, commonly referred to as whales. However, this perception fails to capture important internal changes at a major exchange.
Coinbase recently moved close to 800,000 BTC across its systems. This operation wasn’t as simple as a transfer, but rather a reorganization of unspent transaction outputs, or UTXOs, which are basically a bunch of Bitcoin from past transactions. The process affected multiple categories including those associated with long-term storage.
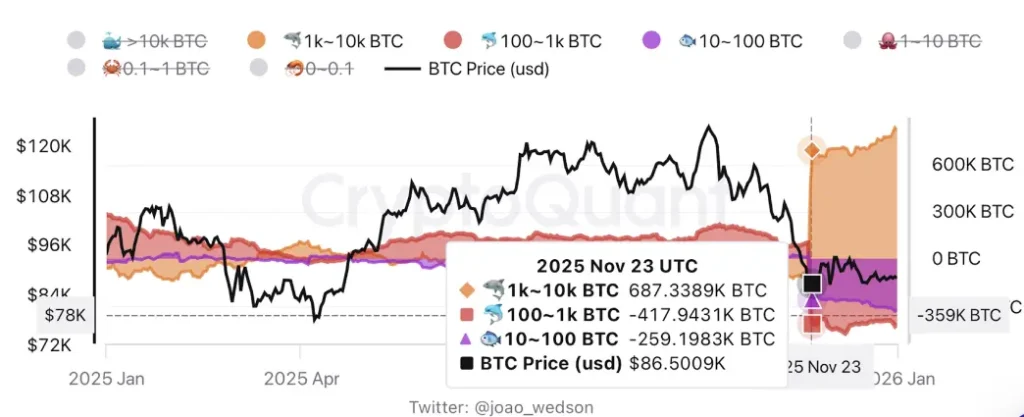
Specifically, the exchange combined small holdings with large ones. This meant breaking down UTXOs of less than 1,000 BTC and forming new ones of more than it. Visual data makes this consolidation very clear.
Around November 23 – across the 22nd to the day following – noticeable adjustments occurred in holder groups:
- Balances from 10 to 100 BTC were reduced by 259,000 BTC.
- Those from 100 to 1,000 BTC went down by 417,000 BTC.
- Meanwhile, the 1,000 to 10,000 BTC range had increased by 687,000 BTC.
Such changes are changes in category, and not fresh inflows or aggressive buying. Market observers point out that this has resulted in large misreadings of signals.
Overall, there are little changes in trading and holding patterns beyond these internal moves. The larger ecosystem is relatively quiet for different segments.
Bitcoin Price Escapes Triangle Range With this Breakout
Over the past seven weeks, the Bitcoin price has consolidated in a narrow range, bounded by two converging trendlines. The lines as dynamic resistance and support revealed the formation of a classic continuation pattern called symmetrical triangle.
The chart setup squeezes the coin price into a triangle peak, before giving a decisive breakout from either end. With Today’s price jump, the buyers gave a decisive breakout from the pattern’s upper boundary.
The breakout backed by momentum indicators RSI surging above 55% accentuated the bullish sentiment in the market. If the breakout holds, the Bitcoin price could climb nearly 11% to challenge the psychological level of $100,000.
A breakout of this barrier would be a key signal of a change in short-term trend.
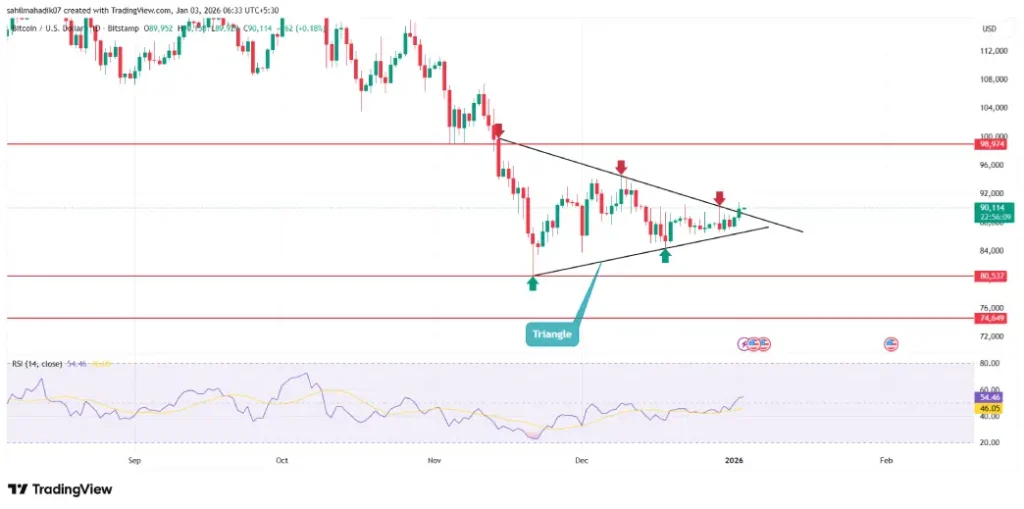
On the contrary, if the Bitcoin price fails to hold this breakout, the sellers could push the price to enter the triangle range and also push a bearish breakdown.

 GoogleNews