





Bitcoin (BTC) , the most valuable cryptocurrency, is currently trading at $84,158.17 with a market cap of $1.67 trillion and a 3.37% increase in the last 24-hours. Volume has also increased by 42.16% in the 24-hour period.
Recent price action suggests cautious optimism among traders as BTC continues to consolidate within a symmetrical triangle pattern formation.
Bitcoin Price Prediction Today: Bullish or Bearish Ahead?
Bitcoin is currently trading within a clearly defined symmetrical triangle pattern on the 4-hour chart indicating a period of consolidation after recent volatility. This pattern is formed by two converging trend lines with similar slopes.
It suggests that a significant price movement could occur when BTC eventually breaks out of this formation.
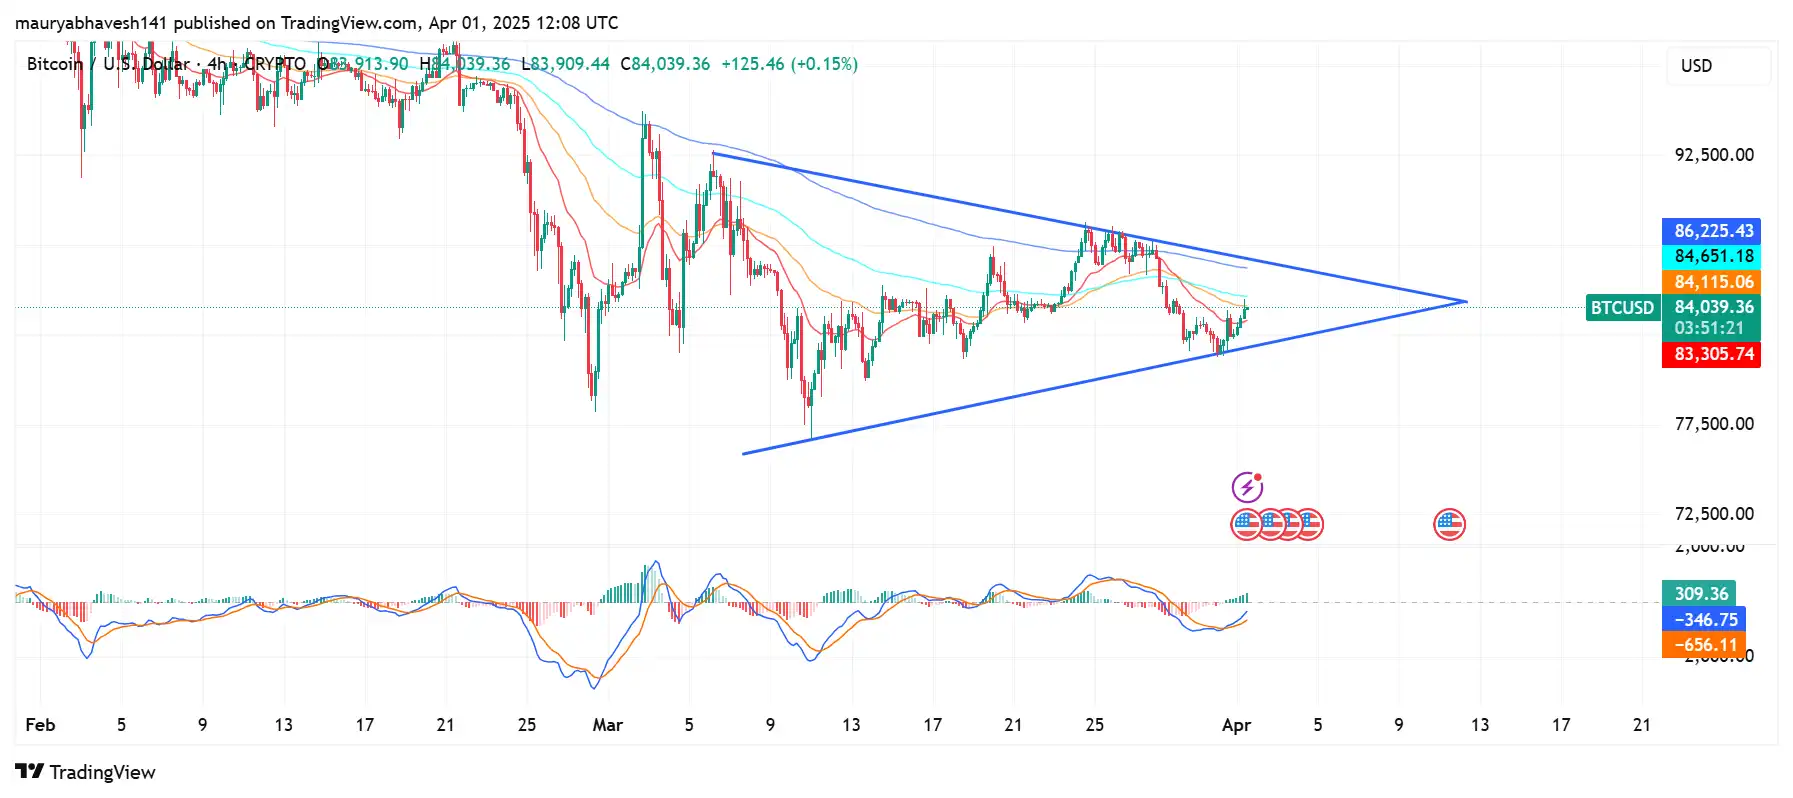
Bitcoin price is below the longer-term EMAs 200 and 100, which indicates there is bearish pressure. If BTC closes above $84,665 100 EMA, it may trigger further upside momentum.
The BTC Price is attempting a recovery and testing mid-term EMAs 50 and 20, suggesting a potential short-term bounce. Strong support currently sits at $81,305 with secondary support at $83,264.
Key resistance levels to watch include $83,966 and $86,251, representing the upper trendline and recent swing high respectively. A decisive break above or below these levels could signal the next directional move.
The MACD indicator shows values of 293.91, -433.52, and -727.43, suggesting mixed momentum signals. The histogram appears to be in positive territory with recent green bars indicating short-term bullish momentum.
However, the MACD line itself remains below the signal line, though it appears to be curving upward, potentially signaling an upcoming bullish crossover if this trajectory continues.
Symmetrical Triangle: Breakout Watch
If a break above $86,250 happens we can see a bullish move towards $90,000. Conversely a break below $83,000 could trigger a move towards $80,000 and in extreme cases $78,000.
Bitcoin Futures
The Bitcoin Open Interest has increased by $500 million the past 3 days. Rising OI and price consolidation inside the symmetrical triangle indicates potential bullish breakout is brewing.
The Long to short ratio currently stands at 0.9763 indicating there is a slightly greater number of short positions. Funding rate currently stands at 0.0031% a slight increase from 31st March, despite a slight increase there is still a bearish sentiment.
Tether Acquires 8,888 Bitcoins
USDT issuer Tether acquired 8,888 $BTC valued at $735M in Q1 2025. Back in May 2023, Tether announced plans to allocate 15% of its profits each quarter to BTC purchases for its reserves.
BTC was acquired gradually throughout the quarter and settled at the end. Tether’s Bitcoin Reserves holds 92,647 $BTC ($7.64B), making it the 6th largest BTC wallet, with an estimated $3.86B unrealized profit. The BTC price dropped 12% in Q1 2025, marking the worst Q1 in 7 years.
Also Read: Ethereum Eyes $1,875 as Bulls Triggers Recovery From $1,775

 GoogleNews