





- The Ethereum price consolidation develops into a double bottom pattern to bolster recovery above the $2,000 barrier..
- Ethereum’s Market Value to Realized Value (MVRV) ratio has dropped into the undervalued zone at 0.78%
- The Relative Strength index surged to 48% suggesting improving bullish sentiment in the market to support price recovery.
On Thursday, the Ethereum price recorded a slight downtick of 1.45% to trade at $2,024. This pullback signals intact supply pressure at weekly resistance level of $2,142, and continuation of its short-term consolidation. While the price action is yet to confirm sustainable recovery, the latest on-chain data shows historical bottoming sign and potential for higher recovery in near term.
ETH’s MVRV Suggests Long-Term Opportunity
Over the past six months, the Ethereum price has fallen from its all-time high of $4,955 to current trading value of $1,975, registering a loss of 60%. Consequently, the asset’s market cap is down $244 billion.
This downtrend aligns with broader market correction amid macroeconomic uncertainty, geopolitical tension, ETF outflows, cascading long-liquidation, and recent conspiracy theory of 10 am dump by Jane Street.
Amid the price correction, Ethereum’s MVRV metrics has recently dropped to undervalued regions.
This metric divides current market capitalization by the aggregate cost basis of all coins (realized cap), revealing average holder profitability. According to analysis shared by market analyst Ali Martinez, the below chart highlights a red line at 3.2, yellow at 2.4, green at 1.0 and blue at 0.80, superimposed on a logarithmic price scale for ETH of $100 to $10,000.
The blue MVRV line has gone below the 0.80 mark several times during previous cycle lows, and was coincident with ETH price troughs in those periods.
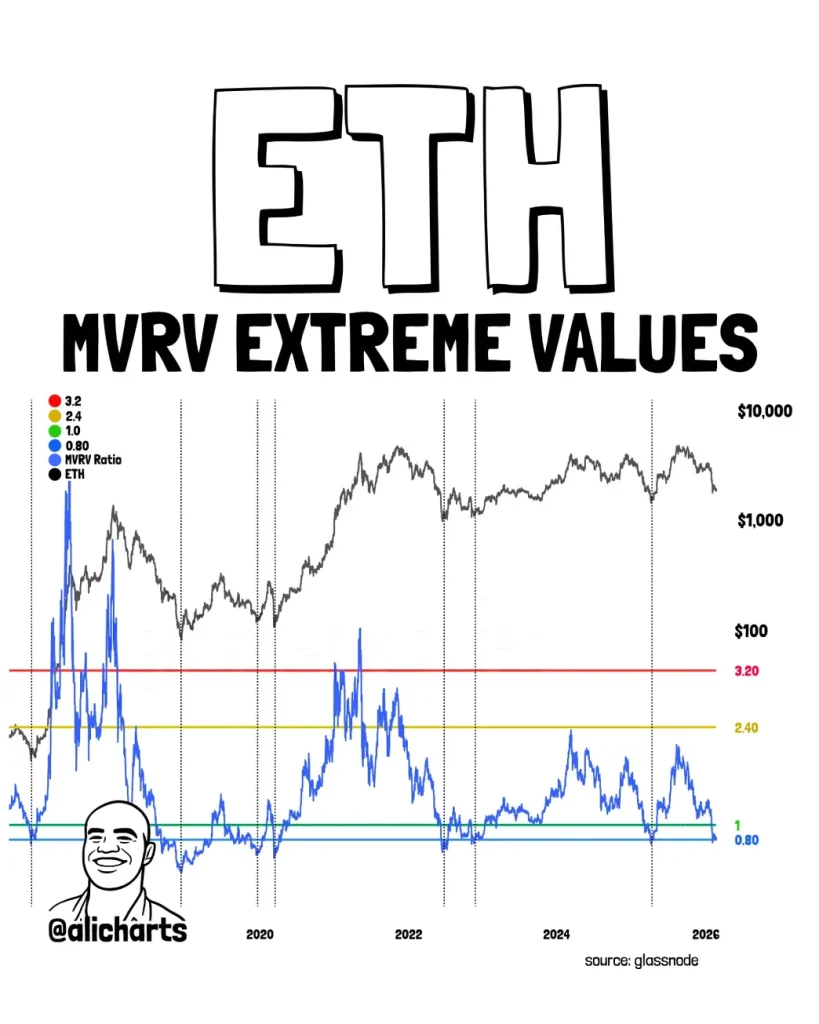
As of late February 2026, the ratio is around 0.78 (dipping into territory correlating to major valuation bottoms for the asset in history). A corresponding historical drawdown is reflected on the accompanying ETH price line (in black), when the ratio entered this sub-0.80 zone.
Recent readings are just below the long-standing 0.80 gap, repeating the same trends we have seen in previous phases of the bear market from 2020-forward, through 2024-2025.
Ethereum Price Eyes Rally to $2.6k With Double Bottom Pattern
Following a significant downturn in early February, the Ethereum price is stabilizing above the $1,800 level. The coin price has been hovering above this support for over three weeks but struggles to break past $2,056 resistance, accentuating market uncertainty and lack of conviction from buyers or sellers.
However, a deeper analysis of ETH’s daily shows two sharp reversals from the $1,800 support, indicating the formation of a double bottom pattern. This ‘W’ shaped pattern is commonly spotted at major market bottoms, signalling a renewed bullish momentum in the market.
A fresh higher low formation in the momentum indicator RSI accentuated the rising buying pressure at the bottom level. Currently, the Ethereum price trades at $2,050 facing overhead supply from $2,056.
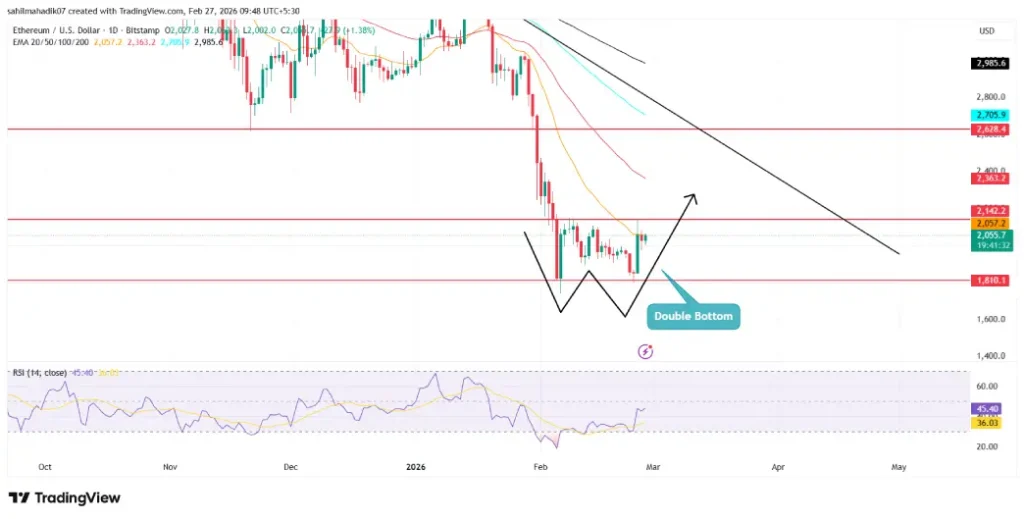
A potential breakout from this resistance will further intensify the buying pressure in market to bolster a recovery towards $2,628.
Also Read: What’s Next for Polkadot Price After Its Rally to $1.7?

 GoogleNews