SOL, the native cryptocurrency of the Solana network, witnessed sharp fluctuations during Tuesday’s U.S. market hours. In the intraday chart, the SOL coin showed a nearly 5% band as its price bounded from a $157.23 day low to a $162.89 high. This heightened volatility likely followed broader market momentum as the House of Representatives voted on three crypto bills. However, the Solana price shows strong resilience amid bullish chart patterns and on-chain growth.
Solana Rallies as DeFi TVL and User Activity See Strong Growth
Over the past three weeks, the Solana price showcased a sustained recovery from $126 to the current trading value of $164.6. The bullish upswing gained its momentum from broader market recovery, ETF speculations, and on-chain growth.
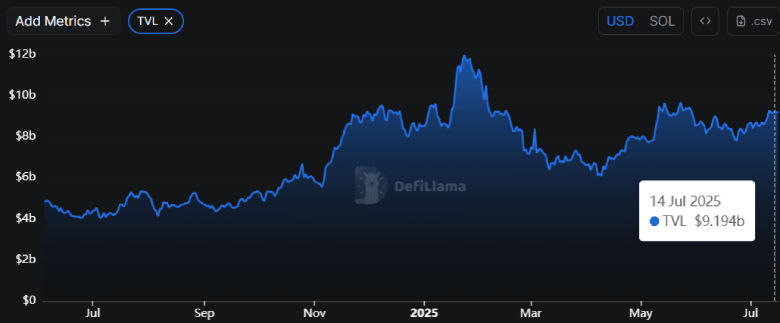
According to DeFiLlama data, the SOL total volume locked has bounced from $7.78 billion to $9.19 billion, registering an 18.1% increase. This surge suggests that market participants are allocating capital into Solana-based DeFi protocols, indicating increasing investor confidence and ecosystem activity.
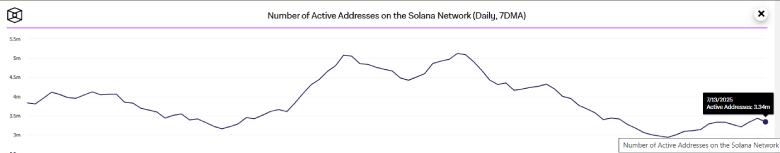
Simultaneously, the number of active addresses on the network has increased from 2.93 million to 3.34 million now, projecting a 14% growth. This rise highlights a notable uptick in user engagement and network activity, suggesting that more participants are interacting with Solana-based applications.
These metrical collectivities indicate growth in the Solana DeFi ecosystem and strengthening of on-chain fundamentals.
SOL Price Near A Major Breakout From Reversal Pattern
Since last week, the Solana price has showcased a sideways action resonating within the two horizontal levels of $168.28 and $157.80.
A deeper analysis of this consolidation showcases the formation of an inverted head and shoulder pattern. The chart setup is commonly spotted at the major bucket bottom and consists of three troughs: the head and two shallow shoulders.
In the intraday chart, the SOL price has recently breached above the $162.9 resistance, signalling a potential 2.4% surge before buyers challenge the pattern’s neckline resistance at $168.28. A bullish breakout from this barrier will signal a major change in market dynamics and accelerated bullish momentum to chase the $178.4 level, followed by the $187.7 swing high.

On the contrary, if the supply pressure at the neckline resistance persists, the SOL price could prolong its current consolidation in the short term.
Also Read: Bitcoin Price Correction Offers Fresh Entry as ETF Inflows Hit $7.78B