




- MicroStrategy (now Strategy Inc.) buys 13,927 BTC for $1B at $71,902 avg.
- Strategy now holds a total of 780,897 BTC worth over $50 billion and now controls 3.7% of the total supply.
- Funded via Series A Perpetual Stretch Preferred Stock, maintaining 5.6% YTD Bitcoin yield strategy.
In a move that reaffirms its position as the world’s preeminent corporate “Bitcoin Treasury,” Strategy Inc. (formerly known as MicroStrategy) announced on Monday that it has acquired an additional 13,927 bitcoins for approximately $1.00 billion. The purchase, disclosed in a Form 8-K filing with the Securities and Exchange Commission (SEC) dated April 13, 2026, marks the company’s largest single acquisition of the current fiscal year.
The acquisition was executed at an average price of approximately $71,902 per Bitcoin, inclusive of fees and expenses. The latest $BTC buy brings the company’s total holdings to a staggering 780,897 BTC. Putting the numbers and figures into perspective, Strategy now controls around 3.7% of the total 21 million Bitcoin supply.
The Bitcoin Buying “Strategy”
Bitcoin recently showed a good recovery after dropping to the sub $70,000 mark during the first quarter of 2026. However, for Strategy, the game was simple: a dip is a buying opportunity. The company showed its resilience by posting a Bitcoin yield of 5.6% year-to-date in 2026.
Interestingly, the recent BTC purchase was made entirely through the issuance and sale of the company’s Series A Perpetual Stretch Preferred Stock between the 6th and 12th of April 2026. Strategy raised $1billion net in proceeds through the at-the-market offering program, allowing the company to leverage its equity to buy “digital gold.”
30-Minute Recovery and Symmetrical Squeeze
The 30-minute price chart for Bitcoin reveals a high-conviction recovery following a localized “stop-run.” After plunging to a structural floor near $70,505 indicated by the green horizontal support band, Bitcoin executed a powerful vertical impulse that reclaimed the $72,000 level. Currently trading at $71,755.79, $BTC is consolidating just below its next major hurdle.
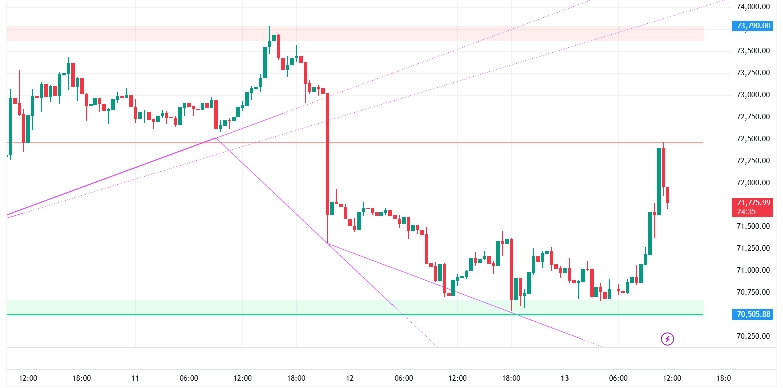
The visual data shows that Bitcoin price has successfully broken out of a descending wedge (marked by the purple trendlines) and is now using the former resistance as a dynamic floor. The price action over the last several hours reflects a staircase pattern, with each dip being aggressively bought up at higher levels.
However, a significant pink zone of supply remains at $73,790- $74,000. This area represents the ultimate barrier where the bears have previously staged a defense. A high-volume close above this zone would likely trigger a massive short-squeeze, effectively erasing the monthly consolidation.
The Relative Strength Index (RSI) is currently trending near the 58 level and has moved out of the oversold territory. A level between 50-65 provides a healthy “runway” for the asset to move toward $74,000 before reaching overbought exhaustion territory.
Furthermore, the Volume Profile indicates that the $70,500 – $71,000 range has become a significant “Value Area” where institutional demand is strongest. As long as the price maintains its footing above the green support zone, the short-term bias remains firmly bullish.
If Bitcoin price can successfully break and hold above the $72,500 resistance on high volume, the first major target is the $73,790 supply zone. A reclaim of this level would effectively signal a move toward the $76,000 – $78,000 range as the “institutional FOMO” narrative gathers steam. A quick slide toward the $68,000 structural floor is probable if the horizontal support at $70,500 fails to hold.
Also Read: Hyperliquid Price Soars as Founder Yan Rejects $100M Funding Offer

 GoogleNews