




On Friday, July 4th, the crypto market experienced a sudden sell-off following a 2% intraday loss in the pioneer cryptocurrency, Bitcoin. This selling pressure can be attributed to market speculation and uncertainty, as some OG Bitcoin whales moved a substantial 80,000 BTC after being dormant for 14.3 years. Despite sentiment pressure, this downtick invalidated a recent breakout from the bullish pattern, signaling a risk of further correction.
80,000 Bitcoin Movement Sparks Panic in the Market
By press time, the Bitcoin price is trading at $107,456 and showing an intraday loss of 2%. This downtick triggered a long liquidation of $35.87 million and plunged the asset’s market cap to $2.136 trillion. A primary reason for this downturn can be linked to markets’ speculation and fear, as some Satoshi-era Bitcoin wallets jointly moved 80,000 BTC (currently worth over $8.68 billion) to a new wallet after being dormant for 14.3 years.
According to Spotonchain data, two of the right wallets received their BTC in early April 2021 when the price was $0.78, while the other six received it in May 2021 at $3.37 per BTC.
Initially worth just $217.80K, the 80,000 BTC are now valued at $8.68 billion—a whopping 39,800x return.
However, the recent transactions raised a potential sell-side pressure in the market.
Bull Traps Set BTC For A Fall to $97,000
Before today’s sell-off, the Bitcoin price showcased a strong recovery from a $98,240 low to a $110,557 high in the last two weeks, accounting for a 12.5% gain. This upswing also offered a bullish breakout from the resistance trendline of a bull flag pattern, which carried a correction trend for the past seven weeks.
The breakout was supposed to provide buyers with a suitable stepping stone to push BTC past the all-time high resistance of 112,000. However, the 2% drop invalidated the flag breakout and likely trapped the hasty buyers in the market.
If the daily candle tomorrow breaks below today’s low of $107,611, the bearish momentum will accelerate. The post-takedown fall could push the price over 8-10% to reach $98,000-$97,000 floor.
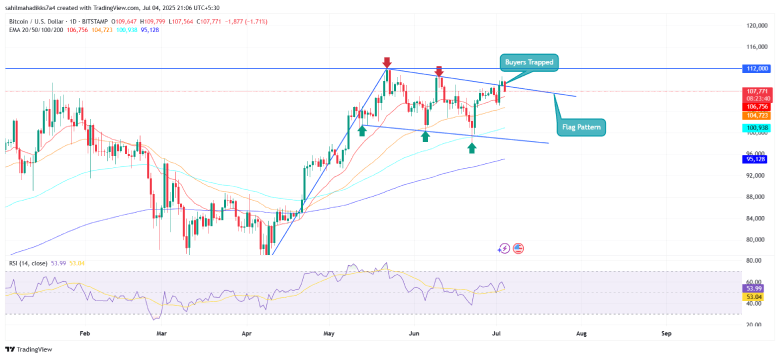
Alternatively, if the coin price manages to hold the $107,373 low, the short-term pullback would eventually evaporate, and buyers could continue with a flag breakout to chase the $120,000 mark.
Also Read: US Gets First Solana Staking ETF, Debuts with $12M Inflows
