





- Ethereum and Solana price coiling within a narrow range could replenish prevailing bearish momentum and drive another support breakdown.
- Overhead supply at $1.5 could force XRP price continued correction and hit $1 support.
- The cumulative buy–sell quote volume difference has dropped to negative $209 billion, marking the deepest imbalance in five years.
The crypto market witnessed a slight downtick during Wednesday’s U.S. market hours, pulling its market cap to $2.31 Trillion. Similarly, the Bitcoin price plunged 1.15% down to currently trade at $66,858. Furthermore, the on-chain data persists selling pressure on the altcoin market, leading to fragmented liquidity across thousands of tokens and risk for prolonged downtrend.
Altcoins Face $209B Selling Imbalance as Market Demand Weakens
Data from CryptoQuant shows that there have been persistent net outflows for spot trading on centralized exchanges for cryptocurrencies other than Bitcoin and Ethereum. The cumulative difference in buy and sell quote volumes over the last year has reached a $209 billion, which is the most significant level in the last five years.
This metric was roughly balanced around zero in January 2025, the most recent period during which supply and demand were balanced. During the 13 months since, the figure has been dropping in one direction, as there has been a steady excess of selling.
Bitcoin is currently trading at around $68,000, after falling from highs of more than $125,000 back in October 2025. Patterns in the data suggest less participation by smaller traders, repositioning by more experienced participants, and less evidence of orchestrated large-volume purchases in these assets. The trend reflects continued distribution on the spot market with no significant reversals.
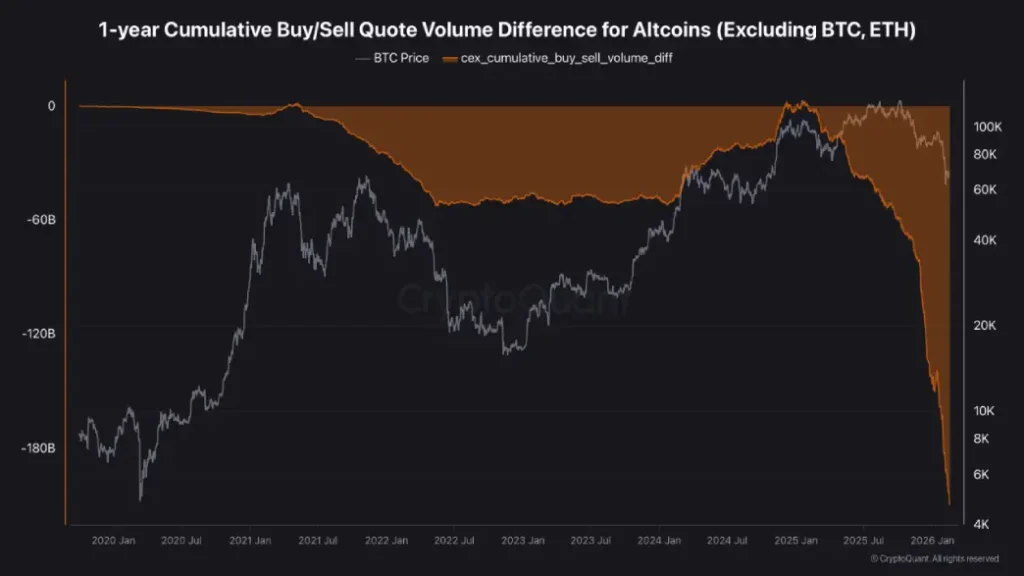 The lack of pronounced institutional spot accumulation by altcoins weakens the sector momentum overall, delaying the possibility of any broad-based recovery or “altseason.”
Ethereum Price Risk Prolonged Correction Amid Inverted Pennant Pattern
The Ethereum price has been wavering in a narrow range within two converging trendlines, indicating the formation of an inverted pennant pattern. The chart setup is characterized by a sharp downtrend, followed by a temporary consolidation to recoup the exhausted bearish momentum.
With today’s downtick of 1.74%, the Ethereum price challenges the bottom trendline of this pattern, signaling a potential breakdown ahead. A bearish breakdown with a 4-hour candle closing below $1,961 would accelerate the selling pressure and send the asset another 17% down to hit $1,623.
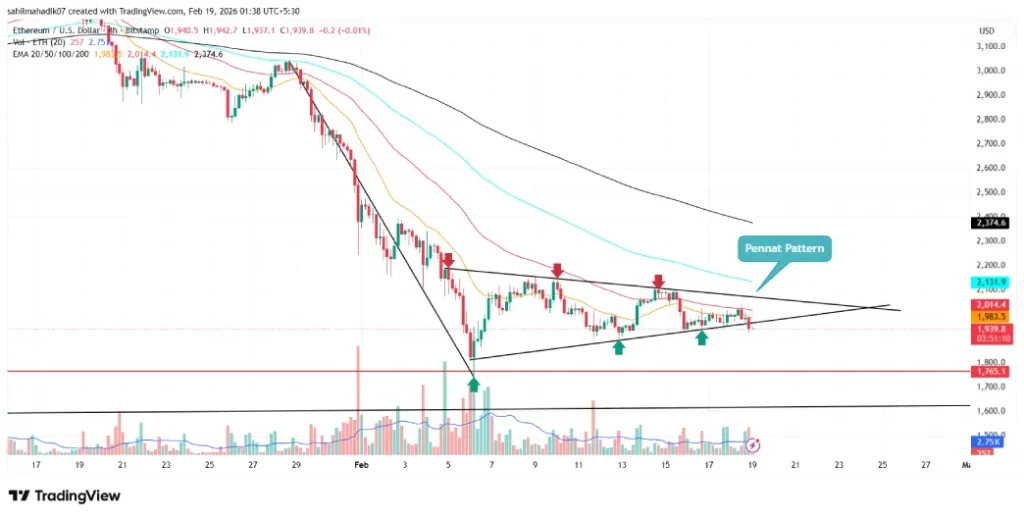
The downloping trend in exponential moving averages (20, 50, 100, and 200) of 4-hour candle shows that the mid-term trend is bearish.
Solana Price Coiling Before Its Next Key Breakdown
The 4-hour chart analysis of Solana shows that the coin price has been resonating between $90.6 and $76.7 for the past two weeks. This consolidation followed a notable correction since early-January 2026, suggesting an opportunity for sellers to replenish the exhausted selling pressure.
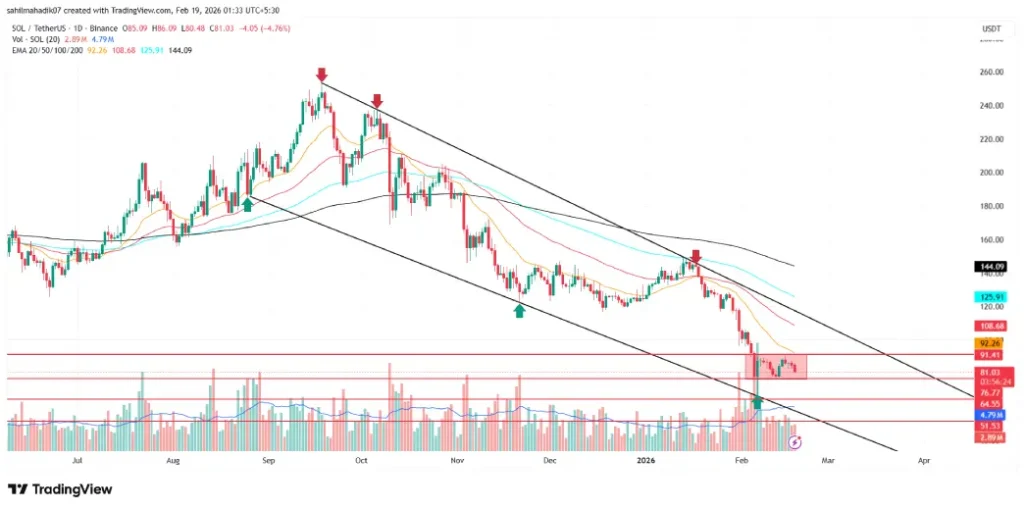
If the bearish momentum persists, the Solana price could plunge 5% down to challenge the bottom trendline at $76.7. Based on the Solana forecast, a bearish breakdown below this floor would strengthen the seller’s grip over this asset and push the SOL price to $64, followed by $51.
XRP Price Revisit $1 Support Amid Broader Market Weakness
From February low of $1.18, the XRP price bounced nearly 28% to currently trade at $1.42. A broader analysis of the daily chart shows this recovery emerged from the support trendline of a falling channel pattern.
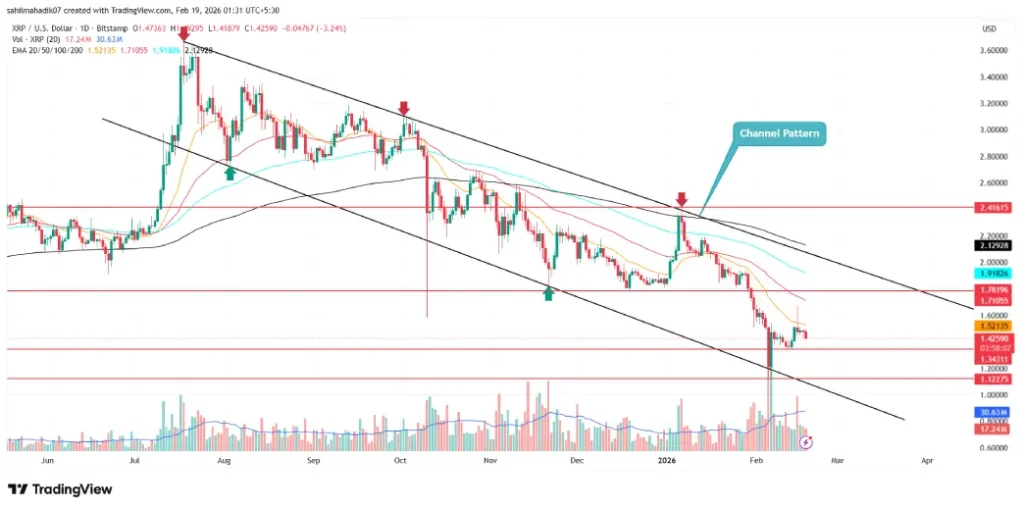
The recent history of this pattern indicates that a reversal from the bottom trendline could push the price to the upper boundary of the channel, currently situated at $1.84. However, the broader market weakness and overhead supply at near $1.5, the XRP price risk of continued correction hit $1 again.

 GoogleNews