




As a broader market witnesses the downfall in the meme coins, Shiba Inu, the second-biggest in its segment, is down by 6%. Currently, the downfall has reached the $0.000015 mark, and its market cap is down to $8.25 billion.
The short-term pullback has marked a huge dent in the prevailing recovery run and limits the chances of an extended rally. Will this result in a downfall of the $0.000010 psychological support? Let’s find out.
Shiba Inu Price Analysis: Correction May Set Up Next Rally
In the 4-hour price chart, the Shiba Inu price trend reveals a massive volitional recovery over the past few weeks. From March 11 to March 26, the Shiba Inu price bounced back by nearly 35%.
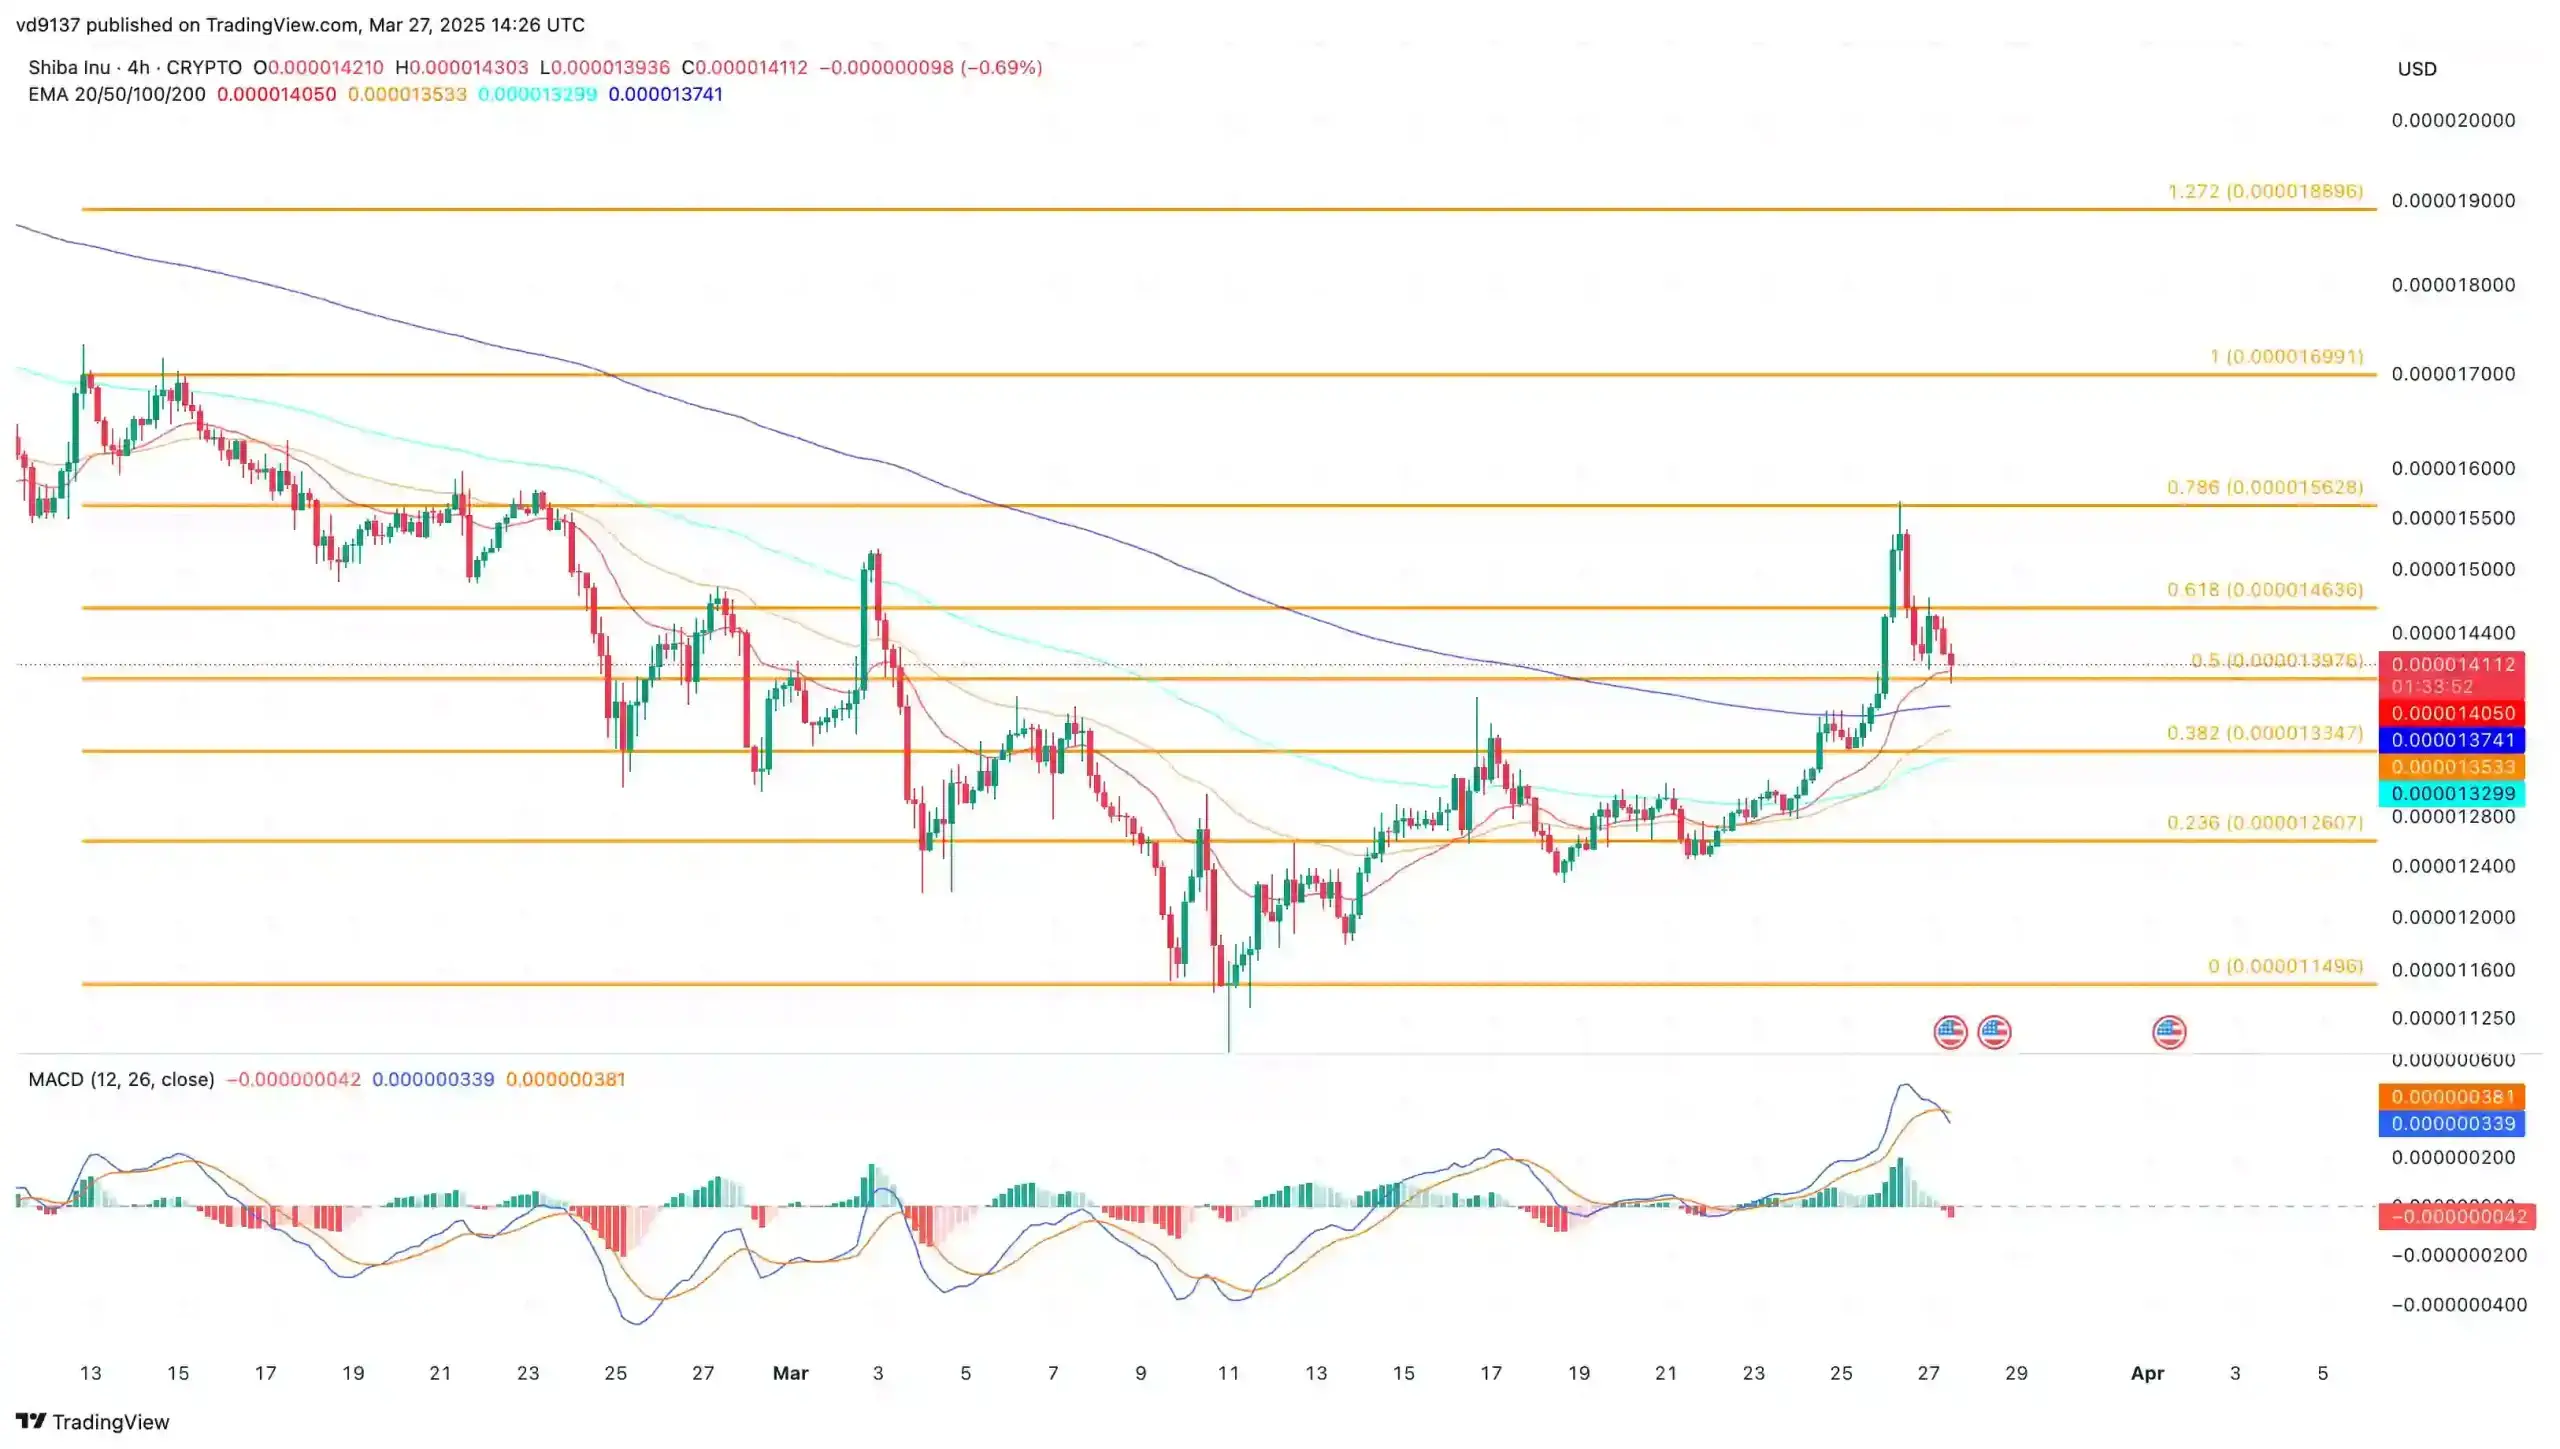
This recovery run lasted from $0.000050 to $0.00001538. However, the bullish recovery in Shiba Inu surpassed the 200-EMA line in the 4-hour chart and led to a positive trend in the MACD and signal lines.
This resulted in a bullish crossover in the 20 and 200-EMA lines and is also teasing a potential golden crossover. Based on the Fibonacci levels, the recovery run challenged the 78.60% Fibonacci level at $0.00001562.
However, the higher price reaction led to a bearish turnaround with an evening sharp pattern. Currently, the downfall is testing the 50% Fibonacci level at close to the $0.000014 mark.
This leads to a negative crossover in the MACD and signal line, triggering a short-term sell signal. However, the rounding bottom reversal is hinting at a potential bullish continuation as the broader market stabilizes.
Shiba Inu Gears Up For 20% Rally
Supporting the bullish chances of a recovery run, BabyTraveler Crypto Analyst highlights a potential 20% surge in Shiba Inu. The traveler highlights an inverted head-and-shoulders pattern found by a cryptoanalyst, Satori BTC.
The neckline of the inverse head-and-shoulder pattern is at $0.0000134. Hence, the short-term pullback comes as a potential retest of the bullish breakout. Supporting the upside chances of a bull run in Shiba Inu, the analyst highlights the recent breakout of the 20-day EMA, driving the bullish momentum.
Furthermore, the SHIB burn report announced a 94.68% drop in Shiba Inu burn rate over the past 24 hours. With only 1.7 million tokens removed, a slower burn rate could result in a declining long-term growth.
As per the price action analysis, the bullish continuation post-retest reversal could result in a 20% rally, reaching the $0.000020 psychological mark.

 GoogleNews