





On Thursday, June 25th, the Solana price recorded a sharp sell-off of over 3.14% to trade at $1.39 mark. A notable red body, with long-wick rejection from the 20-day exponential moving average, signals high selling pressure and a risk of further downfall. Amid the continued decline in Solana’s network, active addresses, and new addresses, the coin price could enter the sub-$130 level. However, the potential formation of a bull flag pattern signals an opportunity for buyers to counterattack.
Solana Downtrend Continues as Network Activity Drops,
Over the past two weeks, the Solana coin price has experienced a significant correction, falling from $168 to $140, with a current trading value of $140, resulting in a 17.66% loss. The geopolitical tension in the Middle East was a primary reason behind this sell-off and the mounting selling pressure in the market.
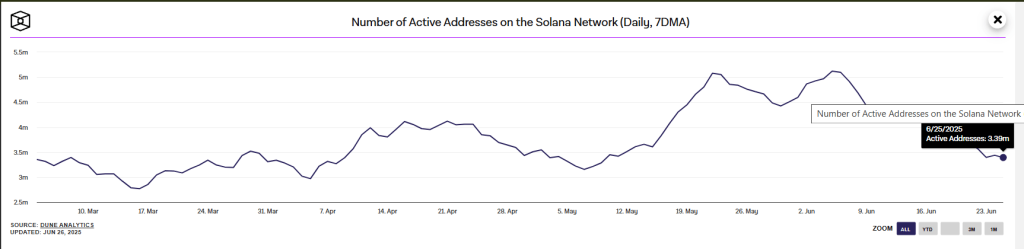
Amid the price decline, the number of active addresses on the Solana dashboard has also plummeted from 5.1 billion to 3.39 billion, representing a 34% loss. The decrease suggests reduced user activity, including lower transaction volumes, staking, and other blockchain interactions. The decline in active addresses suggests diminished confidence or interest from users during the price downturn.
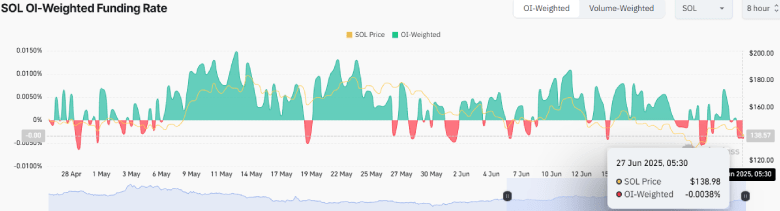
Adding to the bearish note, the Solana OI-weighted funding has just slipped into the negative region, at -0.0038. This indicates the short sellers are paying a premium to hold their short positions, demonstrating the market sentiment for a further downtrend.
SOL Price Eyes Major Breakout Amid Flag Pattern
Over the past six weeks, the Solana price has exhibited a sustained downtrend, characterized by lower highs and lower lows within the two trendlines of a flag pattern. Typically, the chart setup shows a long ascending pole, denoting the dominant trend of the market, followed by a temporary pullback with two falling trendlines, which help to restore the bullish momentum.
With today’s downtick, the coin price shows another bearish reversal within the flag channel, signaling that a sell-the-bounce sentiment remains intact among traders. With sustained selling, the SOL price could plunge another 11.5% to retest the lower trendline $122 mark.
If history repeats, the coin price could rebound and rechallenge the $130 flag resistance.
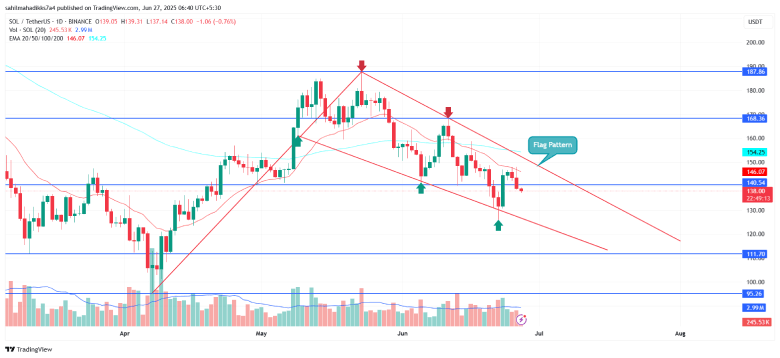
A potential breakout will signal the continuation of the prevailing recovery and chase the initial target of $168 and $187.
Also Read: South Korea Seize $3.2M in Crypto in Major Foreign Exchange Probe

 GoogleNews