
On Tuesday, June 24th, the SUI price experienced a slight 1.09% drop, reaching a value of $2.80. The pullback followed broader market uncertainty as the geopolitical tension in the Middle East persisted after Iran and Israel violated the ceasefire announced by Donald Trump. The declining trend in SUI futures open interest indicates weak bullish momentum and a risk of further correction. However, the daily chart shows a bullish counter opportunity as the price maintains a bullish pattern, with TVL value holding firmly above the $1.5 billion mark.
SUI Counters Market Trend with TVL Growth
Over the past six weeks, the SUI price experienced a sharp correction from $4.29 to $2.29, accounting for a 46% loss. The escalating military action in the Middle East primarily drove this correction.
Following the price correction, Sui futures open interest also declined sharply, dropping from $2.05 billion in late May 2025 to $1.17 billion currently—a significant 43% contraction. This decline suggests that traders are exiting the market or reducing their exposure due to price uncertainty.
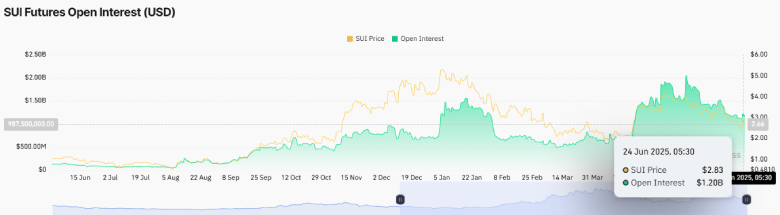
The loss of speculative momentum could slow down price recovery and delay a potential breakout.
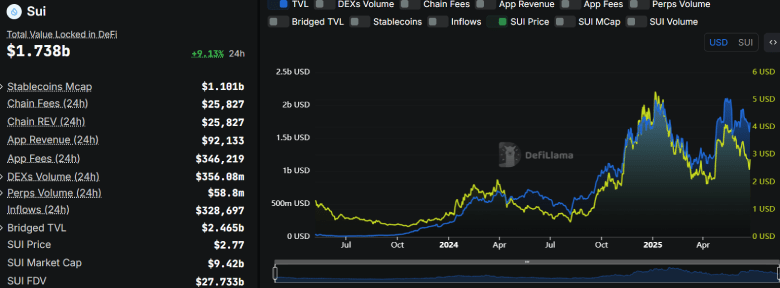
On the contrary, the total volume locked on the SUI network has managed to sustain a level above $1.5 billion.
According to DeFiLlama, the SUI TVL has surged 9.13% in the last 24 hours, reaching $1.738 billion. This surge indicates a renewed surge in user engagement and capital inflow in the SUI DeFi ecosystem. A sustained increase in network TV would reinforce SUI’s position as a rising DeFi competitor.
Also Read: Bitcoin Nears $100K as Leverage Ratio Echoes 2021 China Ban
Bull Flag Pattern Signals a Breakout Ahead
Over the past 48 hours, the SUI price has experienced a notable recovery, rising from $2.29 to $2.80, representing a 22% increase. This upswing, when analyzed in the daily chart, shows a bullish rebound within the formation of a bull flag pattern.
Typically, the corrections placed within this pattern often allow buyers to recuperate the exhausted bullish momentum. If the pattern holds true, the coin price could bounce another 7.4% to challenge the flag resistance at $3.02.

A bullish breakout would accelerate the recovery momentum and drive a rally to $4.3.
Also Read: Mortgage Rules in US May Soon Include Crypto Holdings