


ADA, the native cryptocurrency of the Cardano ecosystem, experienced a negligible loss of 0.06% during Thursday’s US trading session, trading at $0.60. This downtick likely followed broader market uncertainty as the military action between Israel and Iraq continues to escalate. The daily chart analysis indicates that the falling Cardano price has broken down below the support of a major reversal pattern, signaling a risk of a prolonged downtrend.
Declining Open Interest Signals Weak Trader Confidence in ADA
In June 2025, the Cardano price showed a V-top reversal from the $0.70 level to its current trading value of $0.62, resulting in a 17.7% loss. This reversal marked a fresh lower high formation in the daily chart, signaling traders’ sentiment to sell any bullish bounce.
However, the recent downtrend was triggered by the escalating military action in the Middle East, now intensified as the United States is rumored to enter this conflict.
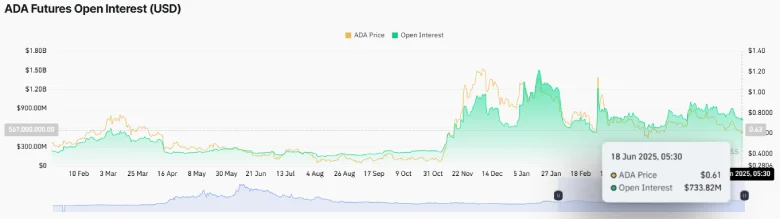
Along with price correction, the derivative market showed a notable decline in Cardanofutures open interest amid the geopolitical tension in the Middle East. According to CoinGlass data, ADA’s OI value plummeted from $1 billion in mid-May 2025 to $739.37 million, representing a 26% decline.
The declining OI value often aligns with reduced leverage and buying pressure, signaling that traders are less optimistic about near-term price recovery.
If the trend persists, the Cardano price could witness a notable low-volatility sideways trend or slower corrections unless fresh catalysts emerge.
Cardano Price Poised For Prolonged Correction
The daily chat analysis of Cardano price shows the formation of a renowned reversal pattern called head-and-shoulders. The pattern consists of three peaks—the central peak (head) flanked by two smaller ones (shoulders).
This structure signals a change in market direction and mounting selling pressure in the market. The coin price trading below the trend-defining exponential moving average of 100 and 200 signals that the sellers remain the dominant force in action.
On June 17, the ADA price gave a bearish breakdown from the neckline support at $0.68, signaling the completion of this pattern.

With sustained bearish momentum, the post-breakdown fall could push the price another 15% to test the multi-month support at $0.51.
Also Read: Ethereum Holds $2.5K Amid War Fears as Whale Buys Rise
