During Wednesday’s U.S. market session, the crypto market witnessed a slight downtick as Bitcoin prices struggled to sustain above $95,000. As the market sentiment is yet to confirm the end-of-correction trend, most major altcoins, including LINK, witness overhead supply. However, the Chainlink price is poised for a major breakout amid key EMA crossover and strong support.
According to CoinGecko data, the LINK price trades at $17.8 with an intraday loss of 2.14%. Currently, the asset’s market cap stands at $11.2 Billion, while the 24-hour trading volume wavers at $1.5 Billion.
- An emerging support trendline drives the current recovery trend in Chainlink price.
- The LINK price potential breakout from $19 will signal the end of the 7-month consolidation trend.
- The 20-and-50-day exponential moving average provides immediate support for the crypto market amid market correction.
Chainlink Price Action Hints Final Pullback Before $19 Breakout
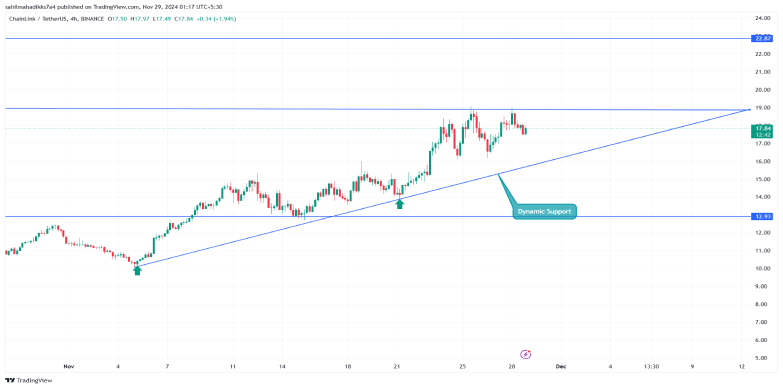
Amid the crypto market correction, the Chainlink price recovery stalled its bullish momentum at $19 level. The 4-hour chart shows multiple rejection candles at the aforementioned level, and sellers are actually defending this resistance.
If the selling pressure persists, the LINK price could plunge 7.8% before testing suitable support from the ascending trendline. The dynamic support intact since early November acts as a suitable accumulation zone for buyers.This technical support aligns with Chainlink’s growing utility in real-world data processing, especially with its AI initiative for unstructured data, potentially increasing institutional interest.
A potential reversal from this support could signal renewed bullish momentum and bolster a breakout from multi-month resistance of $19.
LINK Targets $28.8 as Inverted Head and Shoulders Pattern Emerges
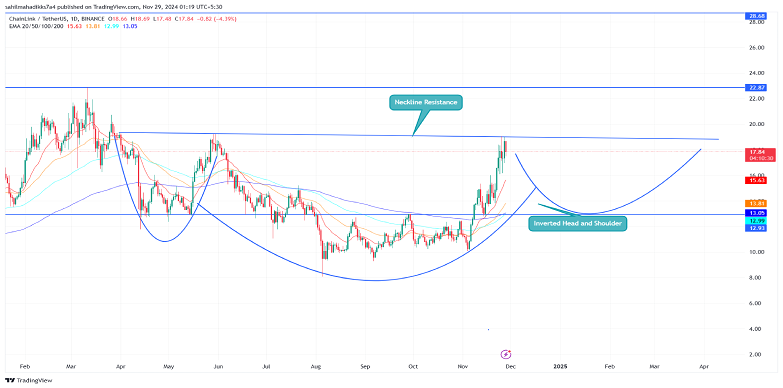
An analysis of the daily chart shows the Chainlink price wavering below a key neckline resistance of inverted head and shoulder pattern. It consists of three troughs: a lower low (the “head”) between two higher lows (the “shoulders”).
A breakout above the neckline signals a potential uptrend, with the price target typically equal to the vertical distance from the head to the neckline. A bullish crossover between 100-and-200-day EMAs could further accelerate the recovery momentum.
Thus, the post-breakout rally could drive 52% up to challenge the $28.8 high.


