
On Monday, July 14th, the crypto market witnessed a slight slowdown in recovery momentum after a week of strong inflow. The top cryptocurrencies, such as Bitcoin and Ethereum, show the mounting selling pressure with long-wick rejection candles in the daily chart. Despite the risk of a potential pullback, high-net-worth investors continue to accumulate ETH, signaling long-term conviction in this asset.
Ethereum Whales Accumulation Counters Short-term Pullback
Since last week, the Ethereum price has bounced from $2,464 to a recent high of $3,082, accounting for a 22% gain. This recovery is likely triggered by investors’ optimism toward the upcoming ‘Crypto Week,’ as the U.S. House of Representatives is set to debate on a series of crucial crypto-related bills.
However, the ETH price witnessed a surge in selling pressure at the $3,000 psychological resistance, evidenced by the long wick rejection in the daily candle. Following a week-long rally, the increasing selling pressure can be attributed to profit booking from short-term holders, increasing the risk of a bearish pullback.
While the potential correction may concern retail traders, the whale buyers continue to accumulate more ETH. According to the blockchain tracker, Lookonchain, an Ethereum whale, 0x3952, has withdrawn an additional 6000 ETH (worth approximately $18.26 million) from the Binance exchange.
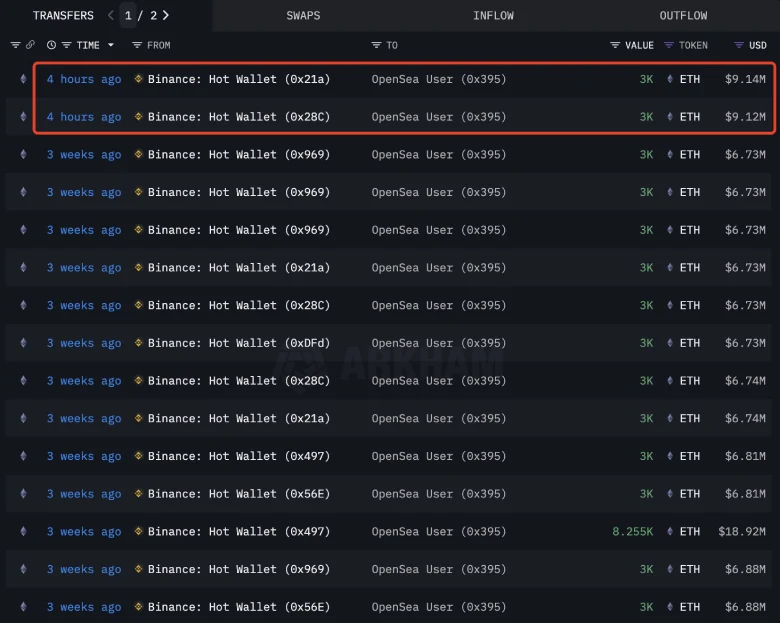
On-chain records reveal that this whale previously withdrew 50,255 ETH (worth $113.85 million) from Binance three weeks ago, bringing its unrealized profit to over $38M.
Historically, whale accumulation during the market dips has renewed recovery momentum in the market and driven prolonged uptrends.
ETH Poised For Pullback Amid Rising Wedge Formation
The four-hour chart analysis of Ethereum price shows the current recovery is resonating within two converging trendlines, indicating the formation of a rising wedge price. Typically, the pattern is considered a reversal setup, which accelerates the selling pressure breakdown below the support trend line.
Currently, the Ethereum price trades at $3,014, standing less than 0.5% above the bottom trend line. A potential breakdown will drive a short-term correction of 3.7% and allow the price to reach the $2,880 neckline of the inverted head and shoulder pattern.
Holding this support is crucial for buyers to maintain their broader bullish trend.

On the contrary, if the price breaks the immediate resistance of $3,024, the consolidation within the wedge pattern will prolong.