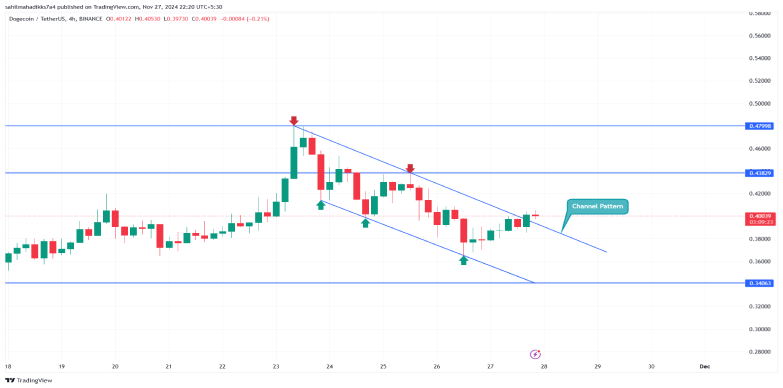
During Wednesday’s U.S. market session, crypto traders saw a brief relief from the correction trend as Bitcoin held steady above $90,000. The meme sector, known for its volatility and sensitivity to speculative trading, reacted quickly to the shift. As a result, Dogecoin surged 4%, reclaiming the $0.4 mark and hinting at a potential bullish breakout from its channel pattern.
According to Coinmarketcap, DOGE’s market cap stands at $59.16 Billion, while the $6.8 Billion.
Key Highlights
- The Dogecoin price breakout from the channel pattern signals the continuation of the prevailing uptrend.
- The $0.44 region stands as a key resistance zone for market buyers.
- A potential formation of a double-top reversal pattern could invalidate the bullish thesis.
Dogecoin Price Signals End-of-Correction Trend
November’s last week witnessed a surge in selling pressure at pioneer cryptocurrency Bitcoin reverted from $98,800. The pullback triggered a correction trend in the altcoin market, with meme cryptocurrency expiring significantly.
Thus, the dog-themed memecoin DOGE plunged from $0.48 to $0.39, accounting for 17.15. An analysis of the 4-hour chart shows the retracement resonated strictly within two downsloping parallel trendlines showcasing a channel pattern formation.
Typically the two trendlines act as dynamic resistance and support before offering a major reversal post-breakout. With today’s price jump, the Dogecoin price flips the overhead trendline into support potential signaling the continuation of the prevailing uptrend.
With sustained buyers, the DOGE price could surge 20% to breach$0.48 resistance and target $0.5. To achieve this rally, a daily candle close above the $0.44 resistance is needed this week.
Bearish Divergence Signals Potential Double-Top Formation
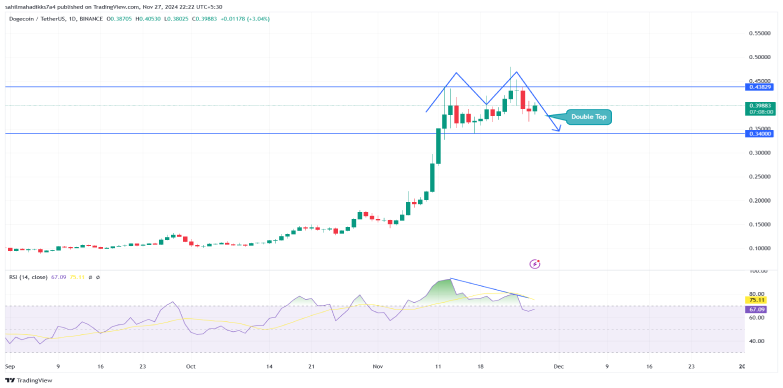
While the recent market correction has bolstered buyers to recuperate the exhausted bullish momentum, the Dogecoin price could struggle to break the $0.438 barrier. The daily long-wick rejection candle at the aforementioned level, indicates the sellers are aggressively defending this level.
In addition, the RSI (relative strength index) indicator shows a fresh lower high formation to price peaks at $0.44, suggesting a loss in bullish momentum. The bearish divergence also projects the potential formation of a well-known reversal pattern called double-top.
If the channel breakout fails, the Dogecoin price could extend the correction with double top and breach $0.34 support.


