Q4 has been historically very bullish for Bitcoin and all signs are pointing to 2024 heading to the same direction. Crypto analysts are speculating that 2024 Q4 could be the parabolic move towards $120,000 and also one of the biggest runs of Bitcoin yet. Considering historical trends and major market catalysts that are perfectly aligned. Let’s dive into why Bitcoin could see a crazy surge in Q4, focusing on historical data and important drivers of the said optimism.
Founder of Wealth Mastery and popular crypto influencer Lark Davis explained the possibility of this with 2 graphs in a post on X.
Bitcoin could make a parabolic move soon.
Here’s why:
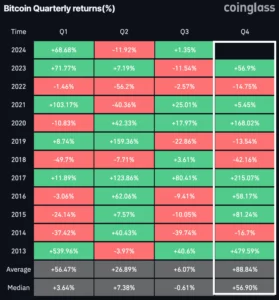
Historically, the average return for Bitcoin in Q4 is 88%.
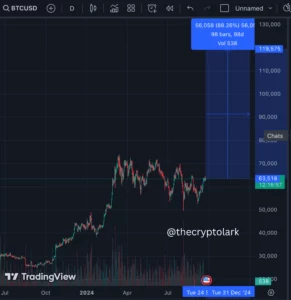
If we see an 88% gain in Q4, it would take Bitcoin close to $120,000.
Even if we get a 55% move upward (like we saw last year), it could take Bitcoin to $100,000.… pic.twitter.com/oVYMAntGA3
— Lark Davis (@TheCryptoLark) September 24, 2024
Historically, Bitcoin returns tend to be very good when the quarter ends, averaging 88%. Amid rising expectations of a parabolic move, several catalysts will fuel these expectations: Bitcoin ETFs, rate cuts, elections, and FTX’s $16B cash repayments this quarter end. Let’s have a closer look at the two main charts that are fueling the bullish sentiment.
Projecting a Massive 88% Move in Q4

The first chart shows that up until now, the possibility of a significant price surge for Bitcoin stands at about 88% in Q4 of 2024. As of today, this price stands about $63,500; if Bitcoin continues producing its historical Q4 trend, then we should see an up move bringing Bitcoin up to about $119,575. The chart even reflects a probable 98-day period when Bitcoin’s price might surpass more than $56,000.
Historically, Bitcoin does this during bull runs primarily when a few market catalysts come together. Here we have a few factors coming together: the approvals of Bitcoin ETFs are going to unlock a fair amount of institutional demand, and macro conditions-the case for the rate cuts-is yet another factor that could add to it. Price chart depicts a parabolic move; indications possible with these favorable conditions calculated to increase 88%.
Historical Context for Q4 Performance

The following chart graphs the Bitcoin returns quarter-by-quarter since the beginning of the listed years. A cursory glance at Q4 by inspection of the graph indicates Bitcoins have generally done very well this quarter. In the extreme years of 2020 and 2017, returns appeared at 168% and 215%, respectively. Even in slightly wackier years, like 2021, Q4 managed a respectable 5.45% return.
This chart shows, on average, Bitcoin’s Q4 returns sitting at 88%, and a median return of 56.9%. Well, this sets up rather nicely as to why Q4 2024 could be a very important moment in time for investors in Bitcoin. Along with some existing historical trends, we now have several market drivers unique to this year, which are absent from prior years, making the parabolic move all the more plausible. This is very volatile, since it pools what could be the floodgates of liquidity into Bitcoin: if FTX’s $16 billion repayment can flow into the market properly.
Will history repeat or does a particular market force in 2024 kick Bitcoin into orbit to another all-time high? Only time will tell. But this much is for sure: Q4 2024 can well make history.
