Bitcoin Price Analysis: BTC Hovers Around its Key Support of $10,000

Since the last 5 days, BTC price is trading with a strong bearish effect as the coin dropped from $12000 and was trading around $11,000. However, recently Bitcoin has seen extended price fall causing it to float around $10,000, its crucial support level.
In the last 24 hours, Bitcoin price has even tested the support levels near $9,992.01, and it is to be seen when the price reverses its loss in valuation.
Bitcoin Current Statistics:
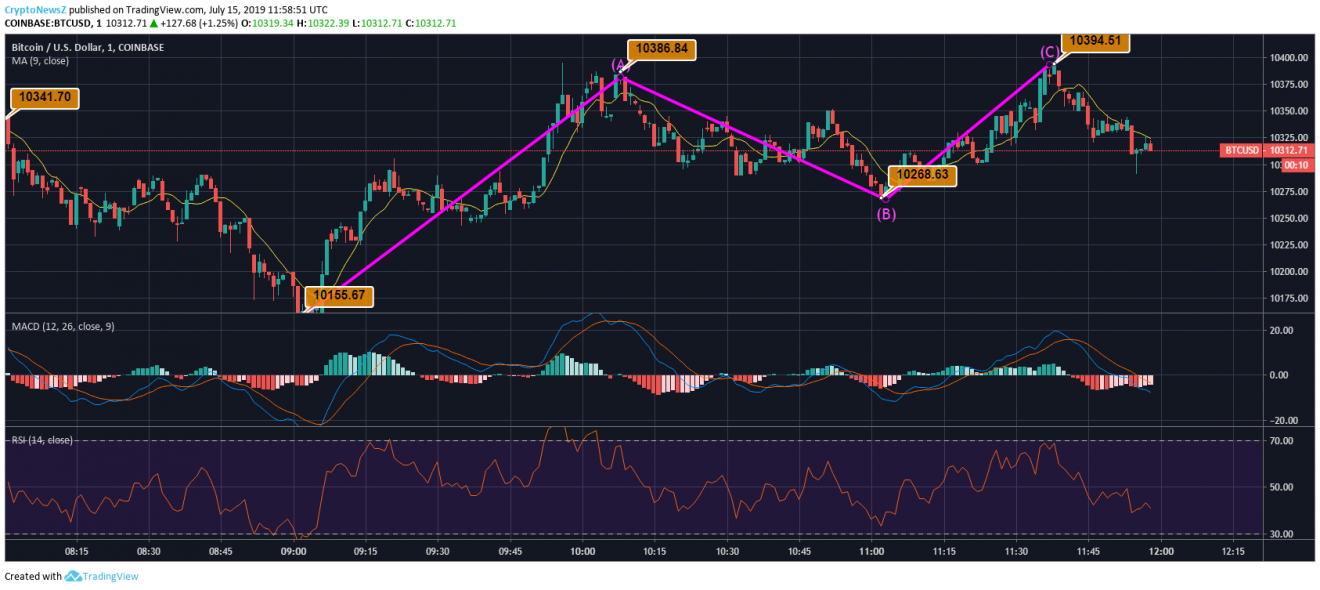
At 11:58:51 UTC, Bitcoin was trading at $10312.71 with a bearish impact. The coin holds Market Capitalization of $184,423,195,603 while having Circulating Supply of 17,818,862 BTC. BTC, at present, fetches RoI of 7,549.58%.
BTC/USD Price Chart
Comparison:
In the last 4 hours, BTC has traced an impulse pattern while its price has been above $10,100. The coin initially fell from its price near $10,341.70 and traded as low as $10,155.67. BTC then corrects up to $10,386.84 and since then the leading crypto coin has been above $10,200. Here the BTC price trades in the narrow range of $10,100 to $10,394.51.
Having a selling pressure, the current price of BTC is well below its 10 days SMA of $11462.25 (by 10.02%).
If you want to know about Bitcoin price expectations for the future, visit our forecast page.
Technical Indicators:
MACD for Bitcoin is moderately volatile as it is currently tracing a bearish price momentum. RSI for BTC is near 40 showing no extremities. As per BTC price forecast, BTC may see major resistance at $11,059.98 and $11,863.9, while further drop can take it to support levels of $9,843.36.


