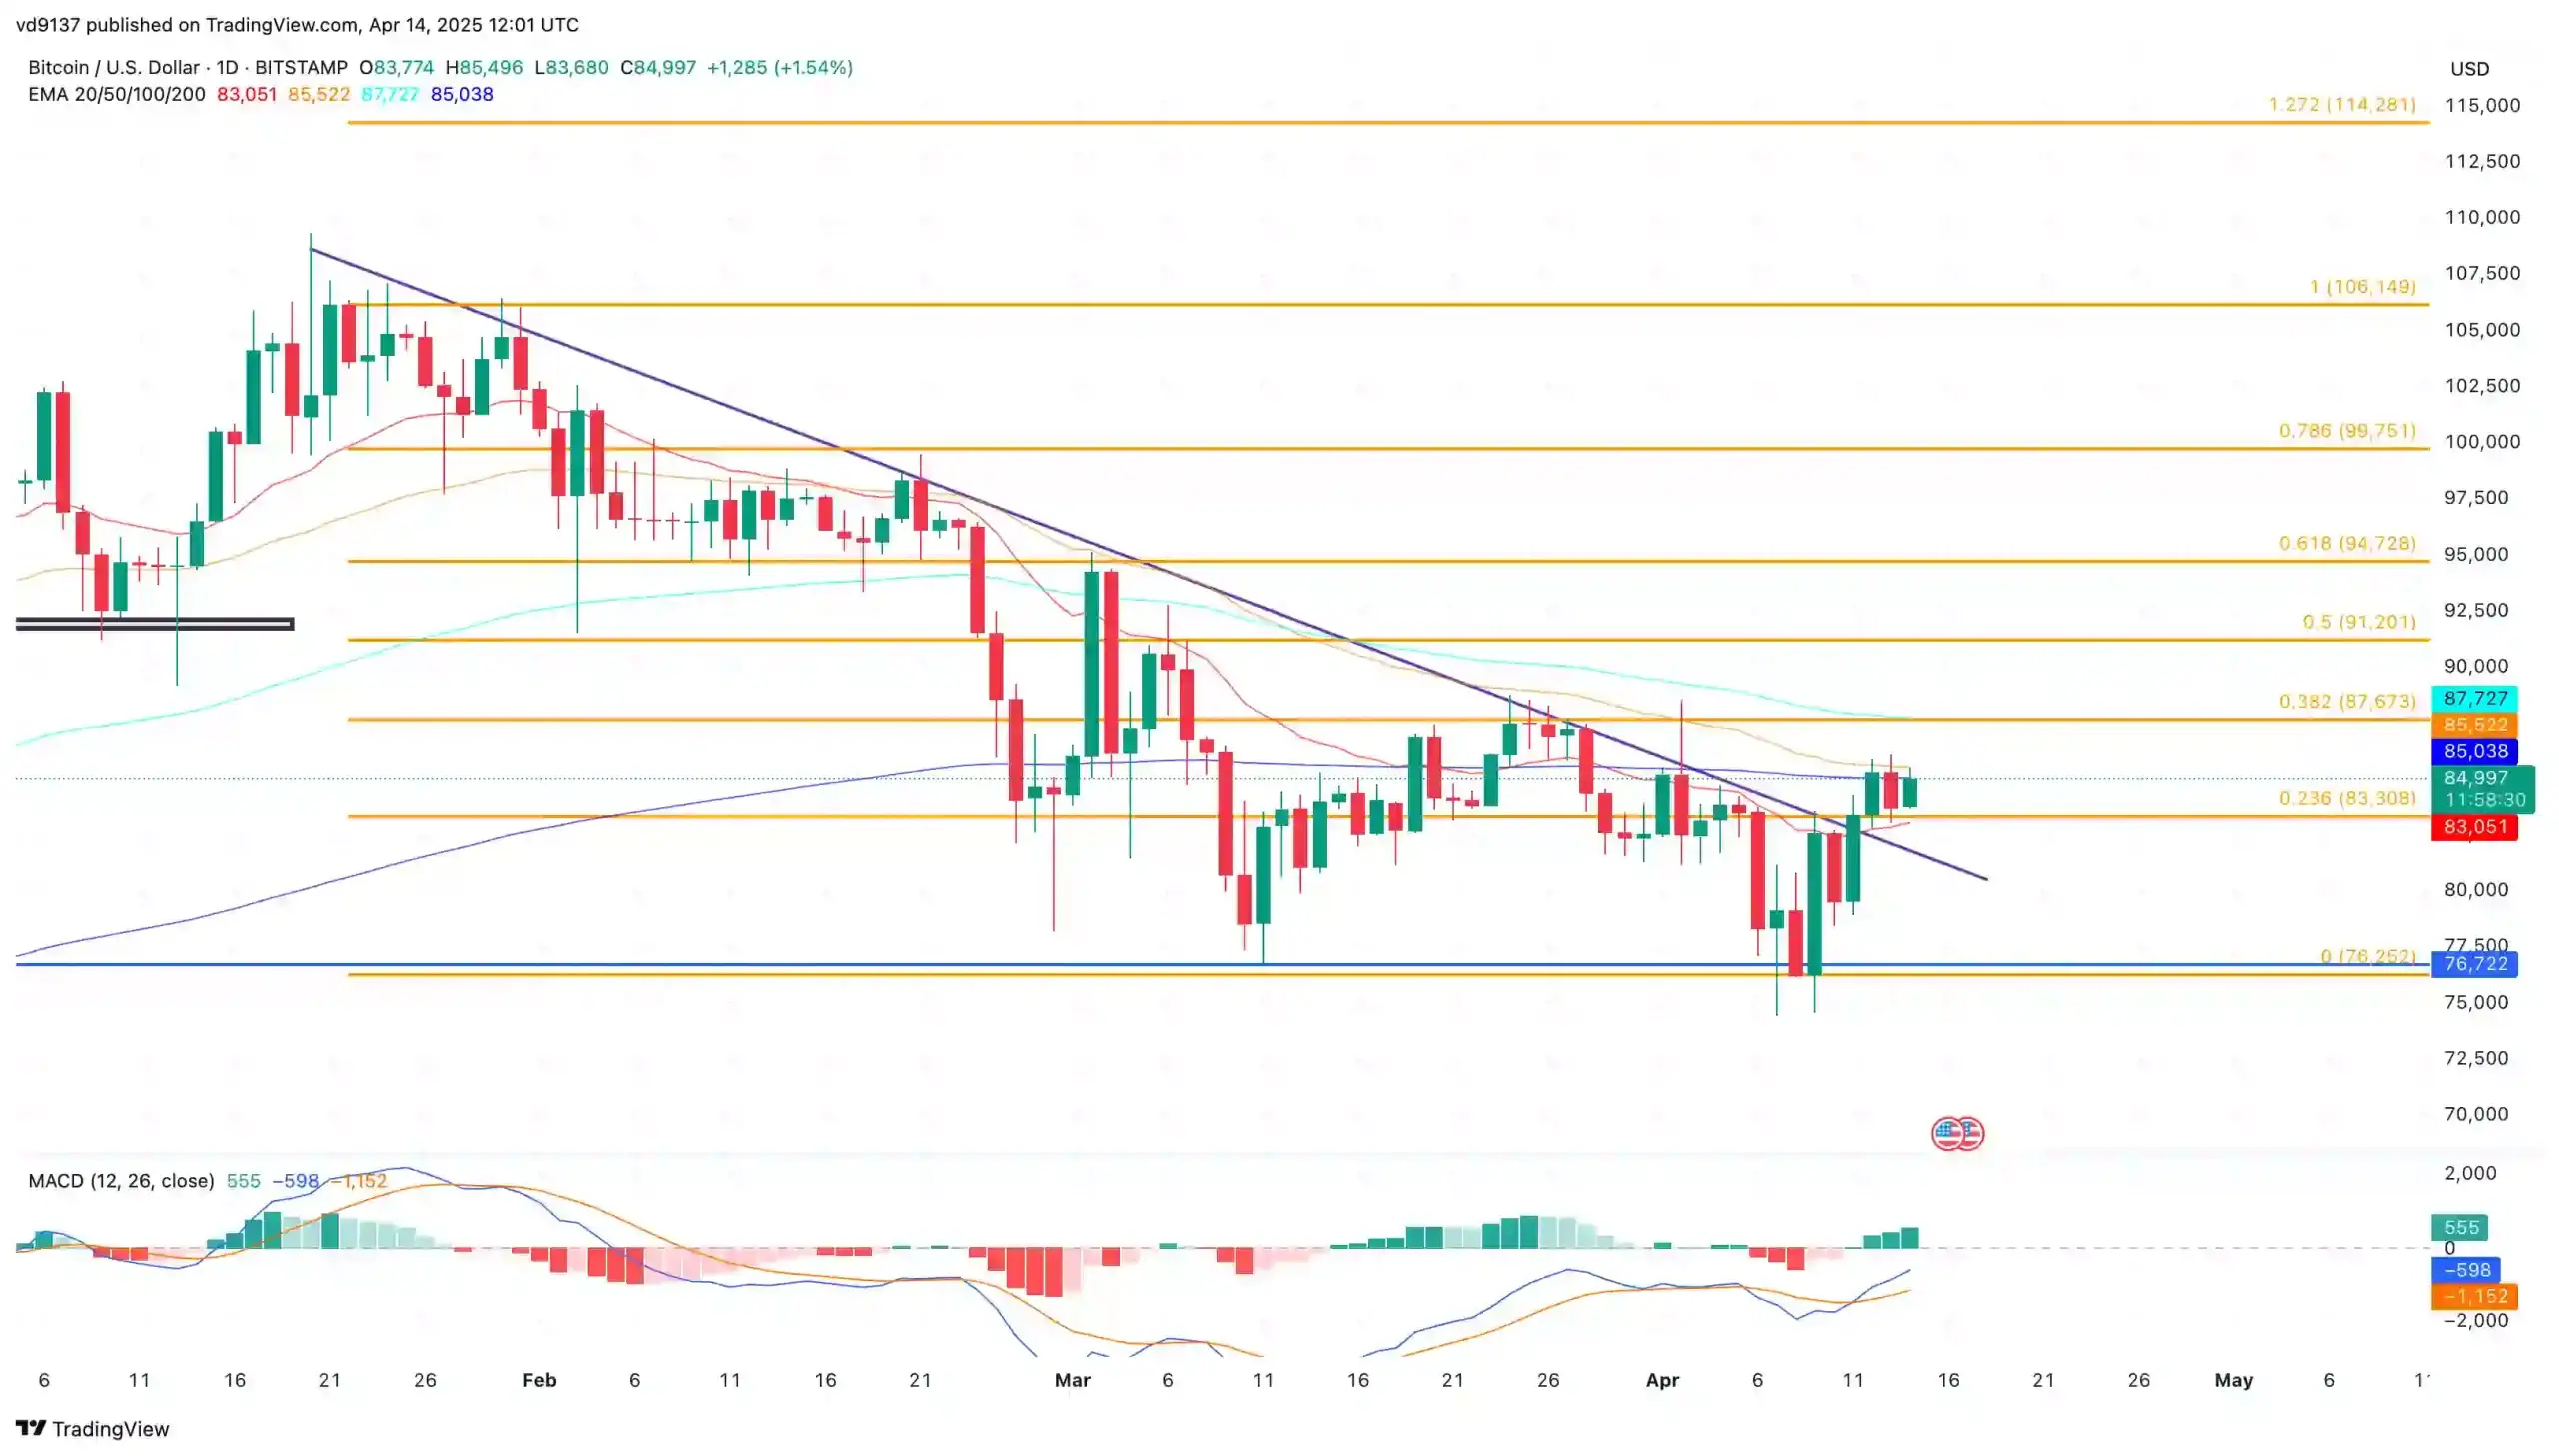
Bitcoin is back at $84,000 with an intraday recovery of 1.33%, currently trading at $84,823 with a 24-hour high at $85,496, sustaining above the 23.60% Fibonacci retracement level.
Bitcoin struggles to drive the recent breakout rally. Will this bullish struggle lead to a longer consolidation, or is the $91,000 mark inevitable? Let’s find out.
Bitcoin Price Analysis: BTC Eyes $91K After Bullish Reversal
In the daily chart, the BTC price trend showcases a quick bullish reversal from $76,722. The recovery line surpasses the overhead resistance trend line and the 23.60% Fibonacci retracement level.

Floating above the recently surfaced resistance support level at $83,308, BTC is preparing to take off. However, the bullish recovery faces opposition from the 200-day exponential moving average line acting as the dynamic resistance.
With the bullish recovery, the Bitcoin price is struggling to avoid a death cross within the 50 and 200-day EMA lines. However, the recovery run is likely to continue to the 38.20% Fibonacci retracement level near the 100-day EMA line.
This crucial resistance is priced near $87,700. Supporting the bullish chances, the recent breakout run resulted in a positive crossover in the MACD and Signal lines.
In case of a bullish breakout, the BTC price trend will likely continue to the 50% Fibonacci level at $91,200. On the flip side, the crucial support for Bitcoin remains at $83,300.
Will High-Leveraged Long Positions Fuel BTC Recovery?
As the broader market conditions remain uncertain despite the recent breakout, the Bitcoin open interest drops by 1.69% to $56.94 billion. This reflects a minor decline in the trader’s interest in Bitcoin derivatives, while the funding rate remains positive.

Currently, it remains at 0.0063%, maintaining an overall optimistic viewpoint. Notably, in the past 12 hours, thelong positions in Bitcoin derivatives have witnessed a recent spike.
The long positions account for 51.14%, driving the long-to-short ratio to 1.0467%. Thus, the derivatives traders anticipate a bullish recovery in Bitcoin.
