Ripple Price Prediction: XRP Trades Sluggishly After a Month-Long Hefty Decline

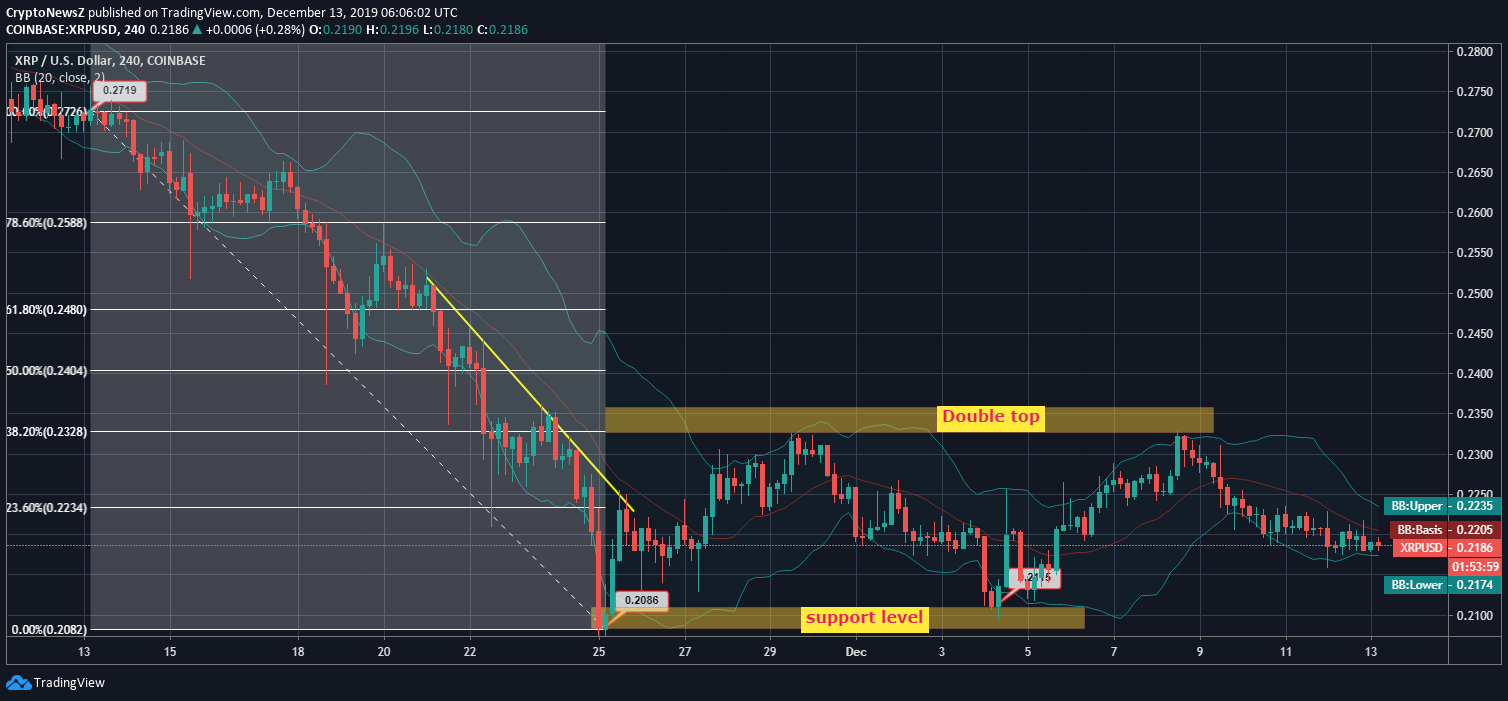
The 1-day price movement of Ripple looks volatile, and still, the coin is not ready to step out of its range-bound mode. The leading altcoin is trading between the narrow price range of $0.21 to $0.23 since November 25, and it needs a strong push. Meanwhile, the 1-month chart of XRP coin shows that the coin is consolidating above the lowest support levels after a major price drop from $0.27 to $0.20.
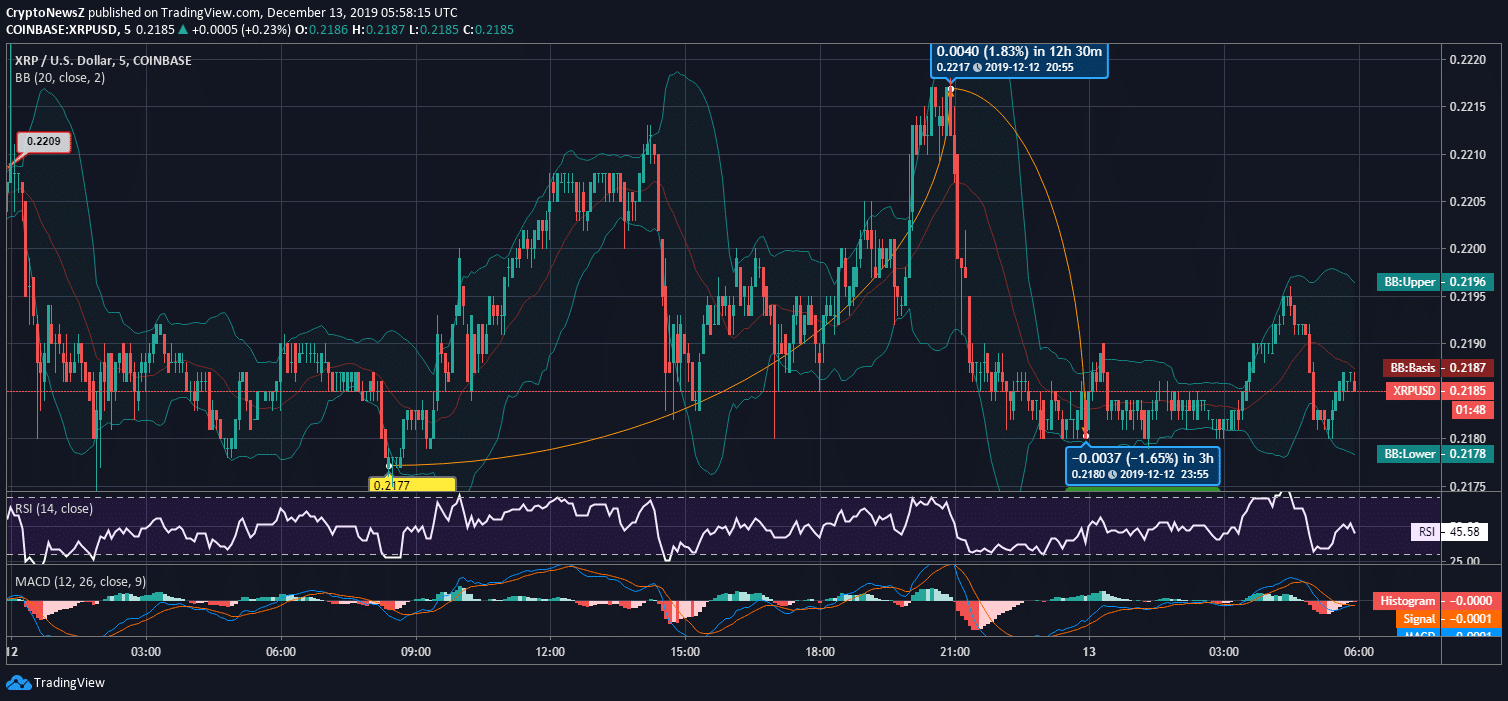
Apart from that, yesterday’s price moves of the coin were initially bearish as it tumbled to $0.2177 from $0.2209. Later, Ripple price rose above $0.2210 before noting a steep pullback of 1.65%. Since then, the coin has not crossed $0.22. At 05:58:15 UTC, The XRP Value is trading at $0.2185.
1-Day Chart of XRP

Bollinger bands are pointing out towards a volatile spell while RSI is stable at 45. MACD chart, on the other hand, is in the bearish zone with its MACD line on the downside.
Related: Check our Ripple Predictions by Experts
1-Month Chart of Ripple
Ripple manifests a major price fall with a bearish bias for a significant part of the 1-Month chart. The bearish trendline was breached when the coin found a support level st $0.2086. Ripple cryptocurrency has found another support level at $0.2115 while it has formed a double top at 38.20% Fib level.
A bullish breakout above 50% Fib level is needed to start a fresh rise, which seems difficult at the moment considering the bearish grip over the crypto market.


