Ripple (XRP) Price Prediction : Exploration of XRP’s Gloomy and Repressed Market

Ripple (XRP) is a technology that works as both- a cryptocurrency and a digital payment network for online financial transactions. XRP denotes the cryptocurrency. It operates on an open source and decentralized peer-to-peer platform that allows for a seamless transfer of revenue in any form – any fiat currency or any cryptocurrency. The digital currency, XRP acts as a bridge to other currencies, because it does not discriminate between the types of currency (Fiat/Crypto) and hence makes exchanging a lot easier.
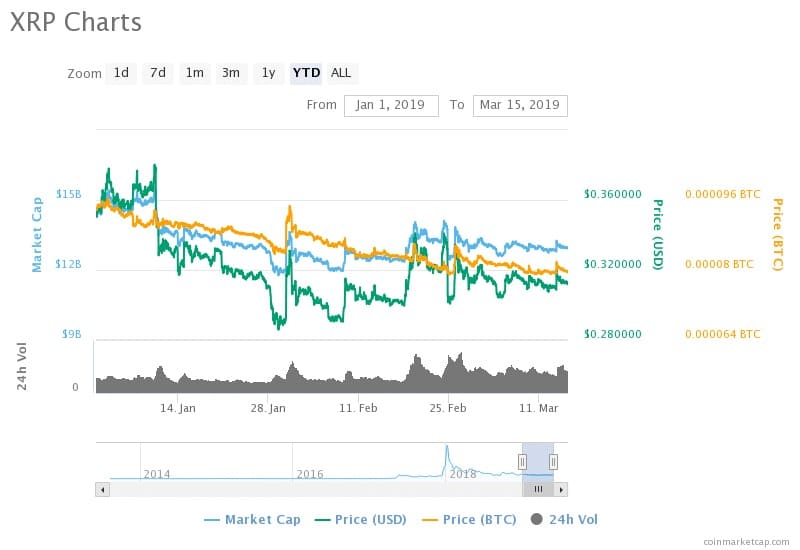
The analysis from Coinmarketcap states that Ripple (XRP) is the 3rd largest cryptocurrency in the market and its market value as on March 15 at 12:24 UTC is USD 12,944,606,454 which is higher than its relative value of USD 12,380,609,746 on February 15. The market has been on a sway with the MCap values. The values traded at 14 billion dollars at the beginning of January and peaked crossing 15 billion USD until January 10. The market was completely downtrodden between January 11 and February 18, when the values fell from a peak to its all-time low with an average of 27.46%. The values then briefly rose for a high of USD 14,105,699,844 which is higher than the current value by 8.91%. The volatility of the cryptocurrency shows in the rise and falls of the values on the market trend analysis. The 20-day Exponential moving average (EMA) exhibits a downtrend in its current value. The values had a relative dip of 2.96% in its current value from its past on February 23 with $13,338,989,405. The values being on the bearish market is degrading the digital currency’s value.
Coinmarketcap has deuced the pricing movements along with the MCap trading rates. The current price of USD and BTC is $0.312429 and 0.00007980 respectively on March 15 at 12:24 UTC. Similar to MCap values, the price of USD has seen major variations in its market trend. The price of BTC has exceeded the price of USD though. Along with the MCap values, the price of USD reached its all-time high after its downtrend period on February 24 at 06:34 UTC with a value of $0.341000. It reached its lowest of $0.285888 on January 29 which is 9.28% lower than the current value. The cryptocurrency reached its milestone between February 18 and 19 when the price of USD spiked from $0.300184 to $0.341068, 13.62% growth within a span of 24 hours. However, the price of BTC has been in oscillation in its terms. It intersects and overlaps the Mcap values and the Price of USD briefly. The Bitcoin’s price trends have majorly been on the downhill. The highest value was on January 31 with 0.00009444 was greater than the present day value by 18.35%, and the lowest has been 0.00007892 on February 25 with a negligible difference in the current value
The 14-day MA also exhibits a downtrend with the values reversing from USD 13,310,295,233 to the current values. Although the percentage is negligible, the overall market looks morose with declining values. This gives the bears an upper hand and rests the market balance pointing in favor of the sellers. The investors and the traders with the investment plan for both short course and long course will have to sideline themselves and explore the market.


