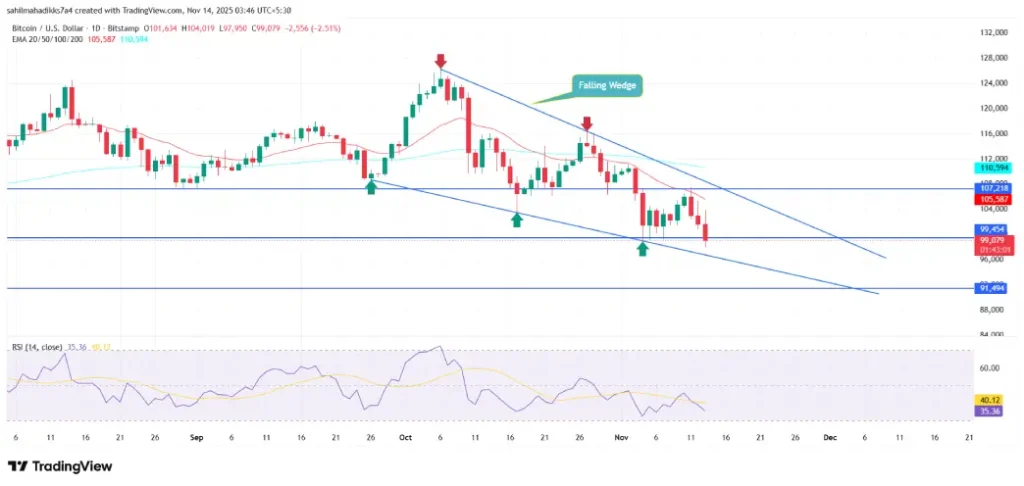
- Bitcoin price correction could drop another 3% before testing the key support trendline of a falling wedge pattern.
- Recent U.S. government shutdown disruptions halted the planned October CPI release.
- BTC fear and greed index at 15% signals extreme fear sentiment among market participants.
On November 13th, the Bitcoin price experienced a sudden sell-off, which pushed its value below the $100,000 psychological level. This selling pressure can be attributed to macroeconomic jitters, particularly those triggered by the delayed U.S. Consumer Price Index data release, accelerating concern around the Fed’s hawkish tone for the December rate cut decision. The continued selling pressure from long-term BTC holders and ETF outflow further accelerates this downswing. Here’s how the short-term correction trajectory could play out.
CPI Delay and Policy Uncertainty Weigh on BTC and Risk Assets
By the press time, the pioneer cryptocurrency Bitcoin plunged 3.16% during Thursday’s U.S. market hours to trade at $98,343. A price breakdown below the $100,000 psychological market has renewed fear sentiment among crypto participants as the risk for prolonged correction persists.
With today’s downtick, the crypto market witnessed a total liquidation of $709.42 million among 194,714 traders, according to Coinglass data. The selling pressure today likely aligns with the broader market pullback, as the recently ended federal government shutdown delayed the CPI data.
The U.S. Bureau of Labor Statistics (BLS) was scheduled to release the October 2025 CPI report on November 13, 2025, at 8:30 AM ET—a critical inflation gauge that influences Federal Reserve policy expectations.
The recently ended government shutdown stalled planned releases of various economic data sets, such as the Consumer Price Index data that were to be released on November 13 at 8: 30 a.m. Eastern Time. Without the inflation report, which is usually seen to provide information on the direction of the monetary policy, market participants were left to speculate on the market dynamics without the expected benchmark. Thus, the anticipations of subdued signs of inflation faded, and talk shifted back to the extension of restrictive money policies.
Along with macroeconomic uncertainty, the U.S.-based spot Bitcoin exchange-traded funds are witnessing irregular inflow. On 12 November 2025, spot Bitcoin ETF recorded a total net outflow of $278 million, signalling a slowdown in.
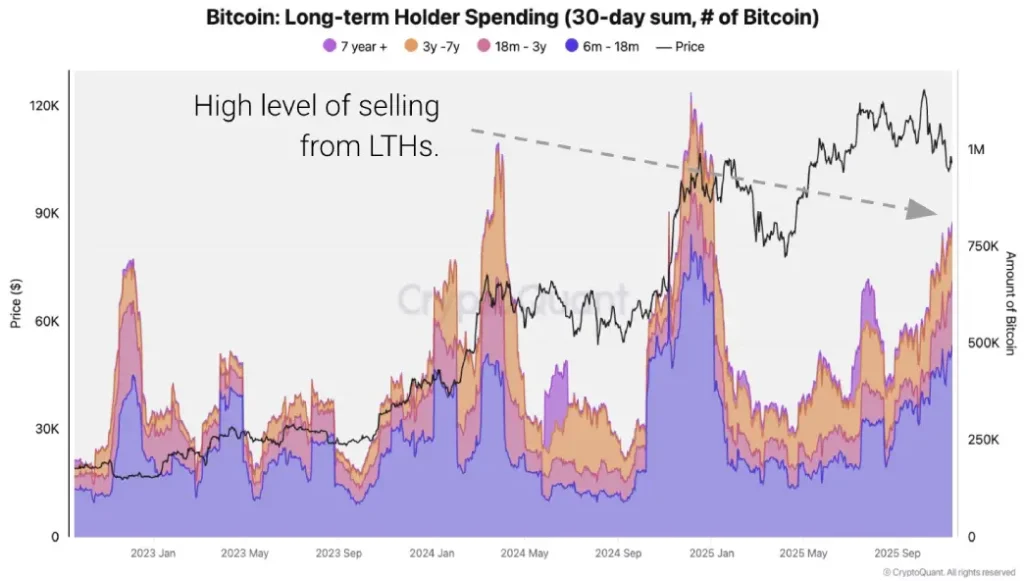
On-chain indicators also showed another supply layer entering the market. Multi-year holders sold approximately 815,000 BTC in the past month, the largest share being given out since early 2024. The increased supply with fewer fresh inflows to counter this action created additional pressure on the price action of the day.
Bitcoin Price Is 3% Short From Key Support Retest
In the last three days, the Bitcoin price witnessed a sharp pullback from $105,600 to the current trading value of $98,350, accounting for an 8.5% loss. When analyzed in the daily timeframe chart, the coin price shows a continued correction within the formation of a falling wedge pattern.
Since early October 2005, the Bitcoin price has been actively resonating within the pattern’s two converging trendlines as they offer dynamic resistance and support to traders. If the market selling pressure persists, the coin price could plunge another 3% drop before retesting the key support trendline around $96,000K.
The potential retest could drive a temporary relief rally towards the pattern’s overhead trend line and test the $100K psychological level as potential resistance.
If the sellers continue to define this dynamic resistance, the current correction could extend to $92,500 support.

On the contrary, a bullish breakout from the pattern’s resistant trendline would signal a renewed recovery in price.
Also Read: Dubai Court Freezes $456M Linked to Justin Sun’s Crypto Aid

