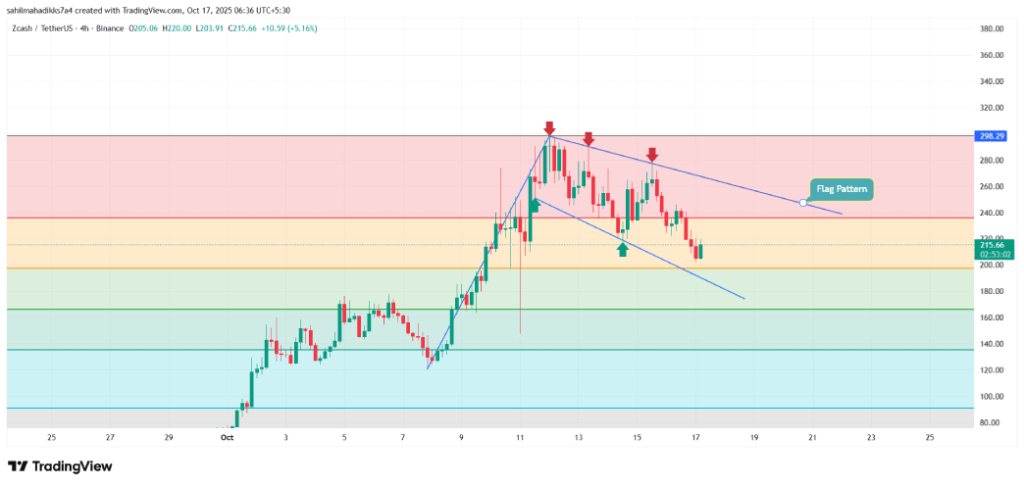
- Zcash price shows a temporary correction amid flag pattern formation.
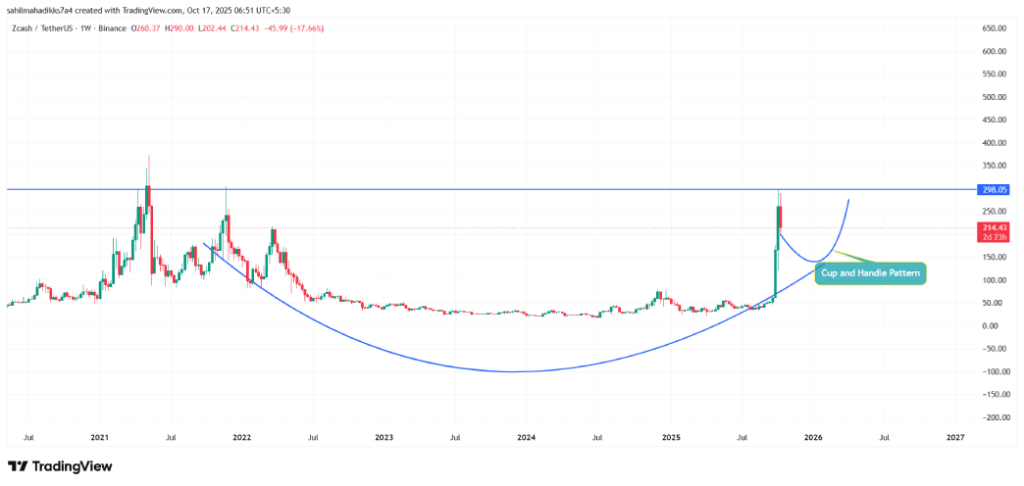
- A cup and handle pattern drives the major sideways trend in ZEC price, building the necessary bullish momentum for a trend change.
- A steep drop in open interest tied to ZEC hints at a drawdown in speculative force in the derivative market.
Zcash, the privacy-focused cryptocurrency, plunged over 9% during Tuesday’s U.S. market hours to trade at $218. The selling aligns with a broader market pullback as the U.S.-China trade tension continues to hurt market sentiment, and Bitcoin price dives below $108,000. The falling price of ZEC is nearing a $200 breakdown, but the broader analysis of the daily chart shows a traditional reversal pattern emerging to drive a higher rally.
Zcash Rally Cools After 300% Surge as Longs Unwind
In the first two weeks of October, the Zcash price witnessed a parabolic surge from $74.2 to $298 swing high, registering a 300% surge. The buying pressure was fueled by a broader narrative shift favoring decentralized and anonymous financial systems amid heightened global scrutiny on crypto surveillance and user data tracking.
A viral endorsement from tech investor Naval Ravikant—calling Zcash “insurance against Bitcoin”—further boosted sentiment. Accumulation by Grayscale’s Zcash Trust and an increased activity in derivatives were a signal of rising confidence for the long-term viability of the asset. Analysts suggest that the upcoming halving event of Zcash may lead to a more restricted supply of Zcash and give the coin a stronger scarcity narrative.
However, the steady rally in Zcash took a bearish turn last weekend, which plunged the price from $298 to the current trading value of $213, accounting for $28.67 loss. Consequently, the asset’s market cap plunged to $3.45 billion.
Following the price decline, the futures contract tied to ZEC witnessed a sharp decline. According to Coinglass data, the ZEC’s open interest fell from $365 million to $255 million, projecting a 30% loss.
The coincident decline in price and OI is a sign of long liquidations and profit taking rather than new short exposure, and is indicative of a near term exhaustion of bullish momentum. While the overall scarcity narrative remains a foundational optimism driver, the recent price action implies Zcash is entering a corrective phase as leveraged positions are being unwound and spot demand is consolidating at the new lower levels.
Zcash Price Drives Short Correction Amid Flag Pattern
The 4-hour chart analysis of Zcash price shows the recent price correction forms a bullish-continuation pattern, called a bull-flag. Since the October 11th crypto crash, the ZEC price has been actively resonating within the two down-sloping trend lines of this pattern, which act as dynamic support and resistance for traders.
Under the pattern’s influence, the coin is poised for another 11% drop before testing the bottom support trendline at $186.5. If the support holds, the coin price shows a history of recuperating its bullish momentum for a bullish reversal towards the upper trendline.

That said, a bullish breakout from the flag’s upper trendline would signal the continuation of the prevailing uptrend.
In addition, a broader analysis of the weekly chart shows this pullback as a potential handle formation of a traditional reversal pattern called cup and handle. The chart setup is characterized by a long-accumulation trend in a saucer shape, followed by a short pullback before the major breakout.

According to the Fibonacci retracement level, the falling Zcash price could witness renewed demand forecast at 38.2% FIB at $197.5, followed by a 50% retracement move at $166.7.
If the pattern holds true, the Zcash price could rally for a $300 neckline breakout.
Also Read: Coinbase CEO: More People Will Use Crypto in Next 10 Years

