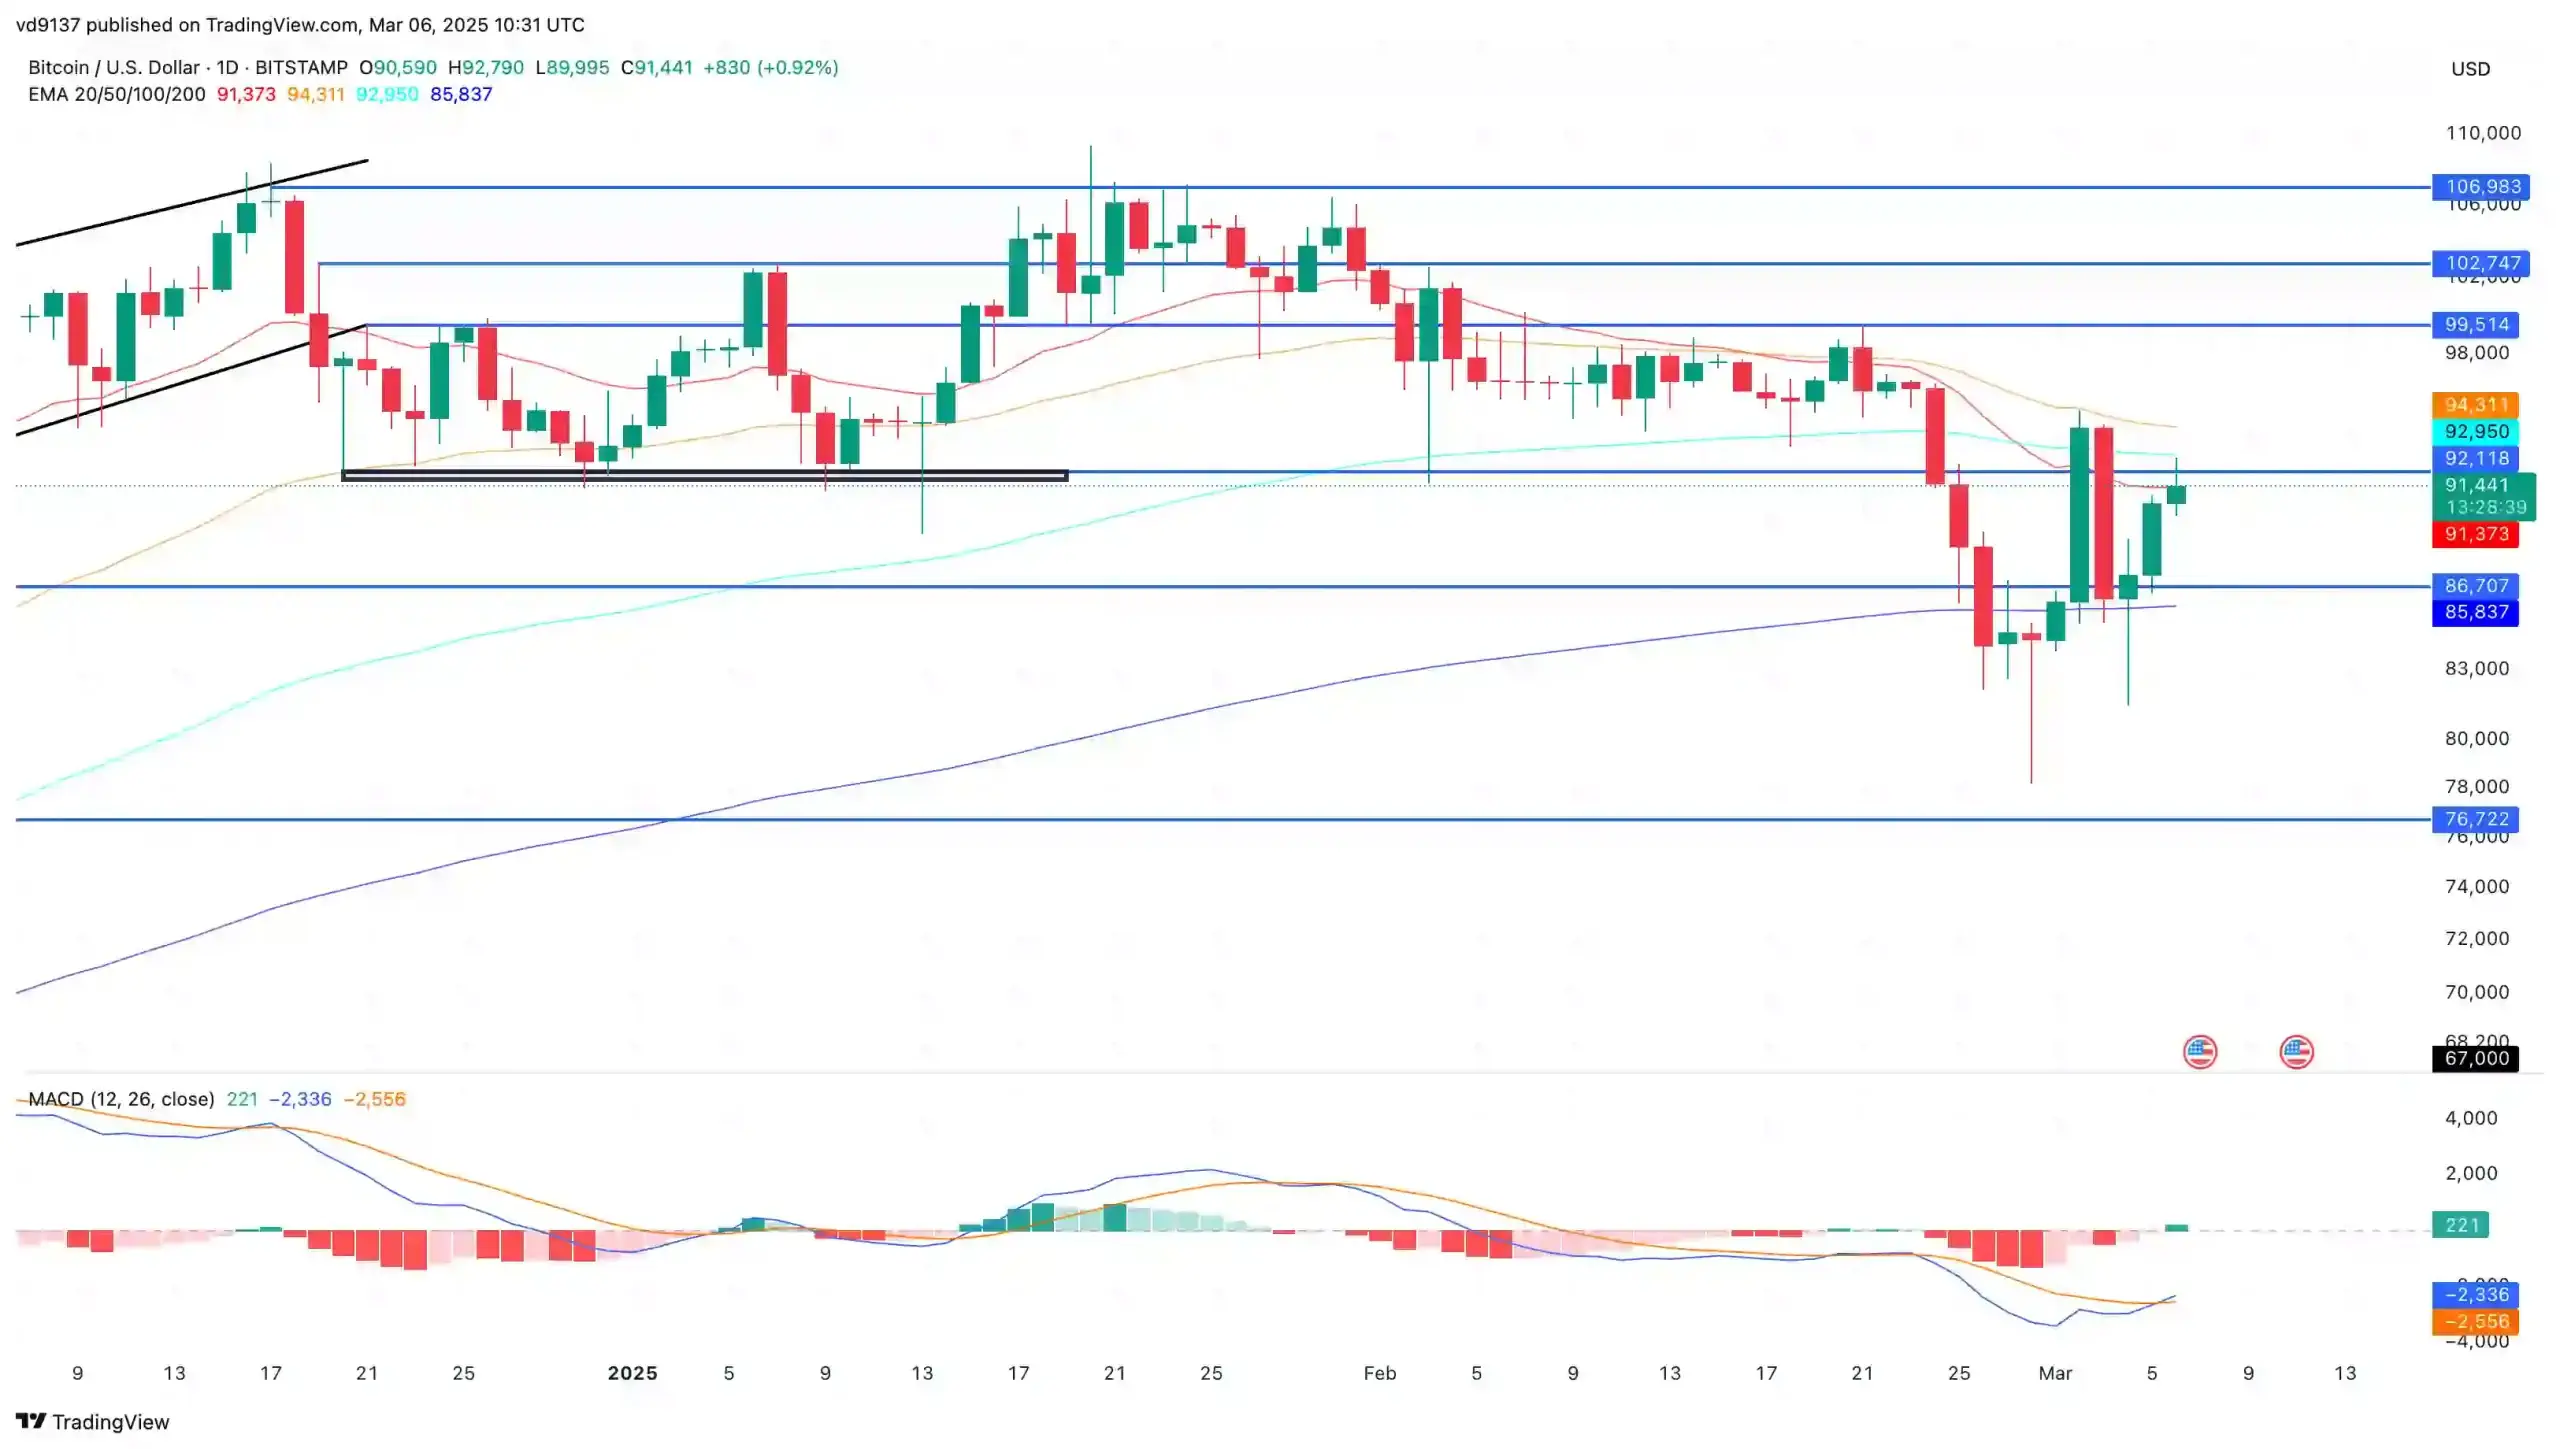
As the crypto market witnessed a short breeze of recovery, Bitcoin reached a 24-hour high of $92,790. Currently, BTC trades at a market price of $91,141, marking its third positive day.
The bullish turnaround is driving the crypto market sentiment, ending at a bullish trend. Will this recovery rally result in a price surge to $100,000? Let’s find out.
Bitcoin Price Analysis : Bullish Continuation on the Horizon
In the daily chart, the BTC price trend showcases a triple white soldier pattern. This comes with three consecutive green candles as Bitcoin bounces off from the 86,000 mark.
The BTC price trend has completed a morning star pattern and is continuing the bullish trend with an intraday rise of nearly 1%. Currently, the BTC price struggles to overcome the $92,000 mark and the 100-day EMA.
Nevertheless, the recovery run has resulted in a positive crossover in the MSDN signal line. Hence, the momentum indicator marks the possibility of a bullish continuation.
With multiple low-price reactions, the recovery run has surpassed the 20-day EMA. Furthermore, the recovery run is close to undermining the near 9% downfall on March 3. If the bullish recovery manages to overcome the bearish engulfing candle, the uptrend will likely be in momentum.
Analyst Suggests Quick Recovery in Coming Weeks
Supporting the chances of a bullish recovery, early market analysis has highlighted a lower price rejection in the BTC prices. Based on the weekly chart, the long-tail formations in the weekly candlestick chart in Bitcoin suggest a strong entry of bulls.
These candlestick wicks on the #Bitcoin $BTC weekly chart indicate strong buying pressure, suggesting bulls are stepping in to defend key support levels! pic.twitter.com/NVRQSzLkY8
— Ali (@ali_charts) March 6, 2025
As Bitcoin defends key support levels, the ongoing inflow rate is likely to create a new swing high in the coming weeks.
Bitcoin ETFs Record Third Consecutive Outflowing Day
On March 5, the U.S. Bitcoin spot ETFs recorded a net outflow of $38.30 million. This marked its third consecutive day of outflow, accounting for nearly $350 million.
On March 5, Valkyrie witnessed an outflow of $60 million, followed by Invesco and Bitwise with $9.94 million and $6.87 million. One major issuer also marked its first day of inflow in the past eight days, worth $38.93 million.
The rest of the Bitcoin ETFs in the U.S. market met in a net zero flow.
Bitcoin Price Targets
Based on the transaction analysis, the recovery run in Bitcoin is likely to reach the $100,000 mark if it exceeds the 100-day EMA line. On the flip side, the crucial support for BTC remains the 200-day EMA line at $85,800.

