


Since last week, the Bitcoin price has been grappling with the $108,000 barrier, which has also limited the recovery momentum in the altcoin market. Despite the sluggish trend, the on-chain data highlights a consistent decline in BTC exchange reserves and miners’ OTC balances, which historically aligned with major bullish cycles. Is the pioneer cryptocurrency ready for a new high?
Bitcoin Exchange Reserve and OTC Balances Signal Looming Supply Shock
Over the past week, the Bitcoin price has showcased a sharp recovery, rising from $98,420 to $107,638, representing a 9.58% increase. The bullish momentum has currently slowed down at $108,000, but a series of on-chain data points to a bullish structure for BTC.
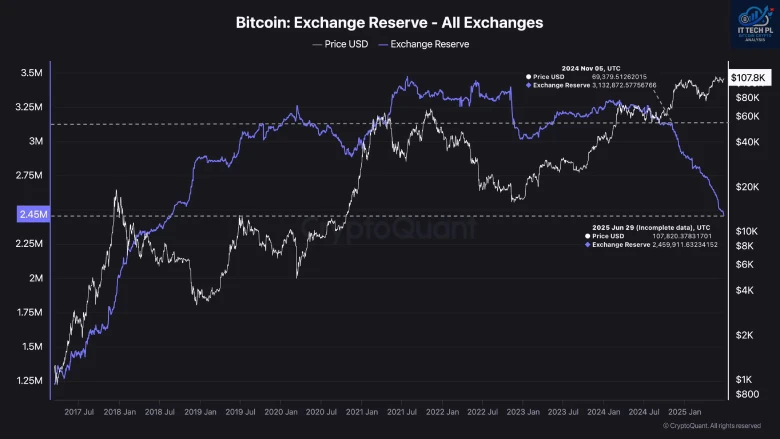
According to CryptoQuant analyst IT Tech, Bitcoin reserves on the exchange have recently dropped to 2.45 BTC, its lowest level since March. The consistent decline in exchange holdings reduces sell-side pressure as coins are moved from trading platforms to long-term custody or cold storage.
A similar downtrend is observed in OTC balances, which miners and institutions primarily use for large private transactions. The current miner OTC holding stands at 156.6k BTC, marking a multi-year low.
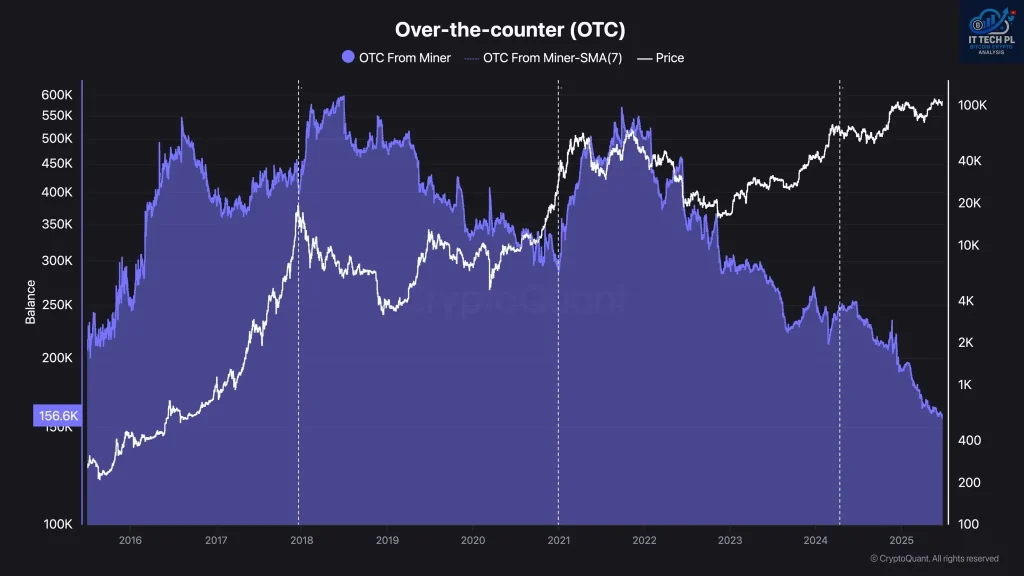
“Both falling exchange reserves and diminishing OTC balances indicate that short-term liquid supply is tightening, especially from miners,” the analyst added.
Historically, such a decline in these metrics has often led to major upside trends.
BTC Hints at Last Pullback Before Flag Breakout
By press time, the Bitcoin price trades at $107,601 with an intraday loss of 0.72%. Despite the downtick, the daily candle shows a notable rejection tail, accentuating the demand pressure on the lower side.
Thus, the coin price could continue its sideways trend below the pattern’s resistance trendline before providing a sustainable breakout. If materialized, the BTC price could surpass the all-time high resistance of $112,000 and take an initial leap to $119,000, followed by an extended carry to $137,000.

On the contrary, if supply pressure at the $108,000 resistance persists, the price could fall below the 20-day exponential moving average, signaling a continued correction.
Also Read: South Korea Seizes $3.2M in Major Crypto Crackdown
